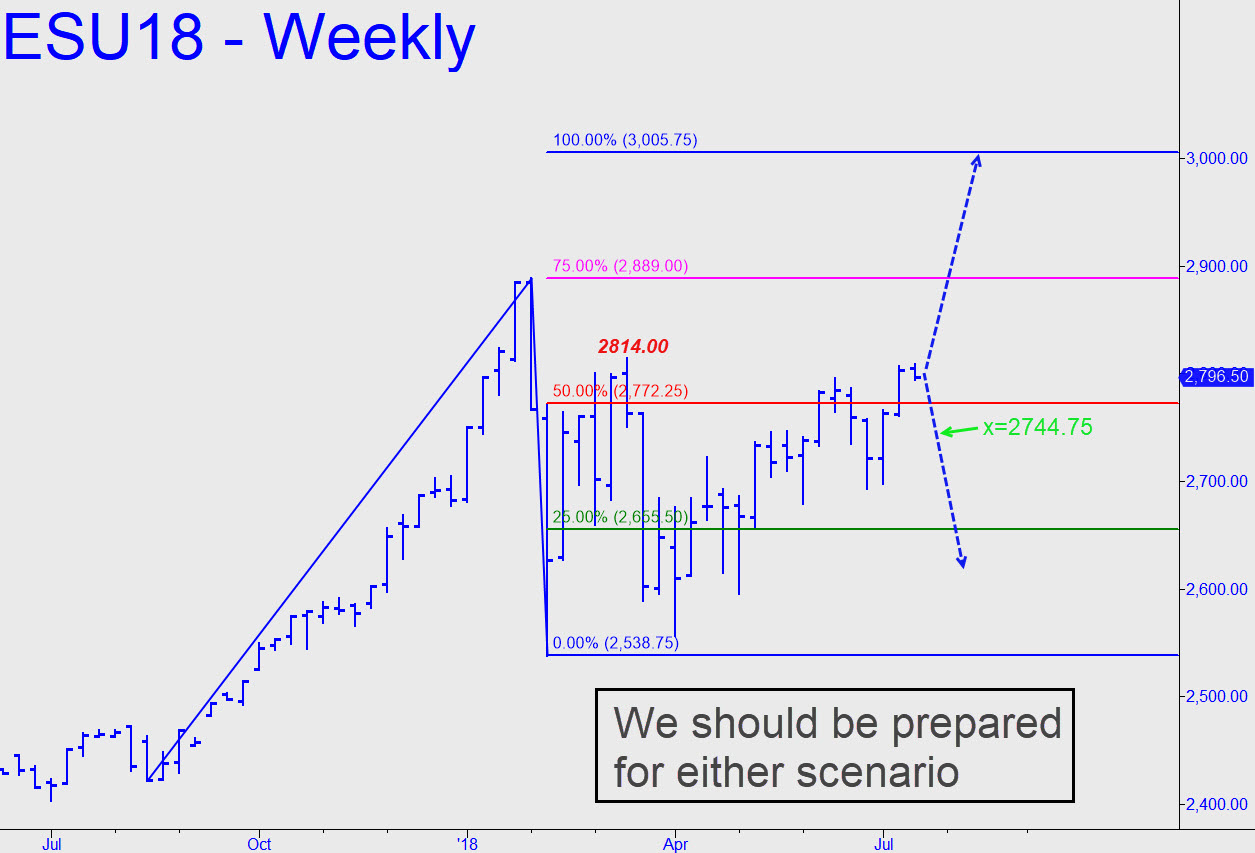
 Today’s chart returns our focus to a key peak at 2814.00 recorded in mid-March just before the futures plunged 257 points. Monday’s high fell five points shy of it, but buyers will need to exceed it in order to generate a bullish impulse leg on the weekly/daily charts. It would be the first such impulse leg since the market took an even bigger header in February, and it would put the 3005.75 target shown nominally in play. Just to be cautious, and to avoid getting taken in by a false breakout, we will think this through as a possible ‘counterintuitive’ short, using 2814.00 as the point ‘A’ high of the short-able pattern. Assuming Monday’s high at 2809.00 stands, a decline over the next couple of days to 2744.75 would trip the entry signal. ______ UPDATE (July 17, 9:15 p.m.): The futures are ratcheting above 2814.00 tonight, bidding fair to achieve at least 2832.25 over the very near-term. The fact that they did not pull back to the green line to give us a ‘mechanical’ buying opportunity attests to the eagerness of buyers. Here’s the latest chart. _______ UPDATE (July 29, 6.21 p.m.): Today’s cantankerous price action lowered my immediate target somewhat, to 2827.00. Midpoint resistance lies at 2813.75, two ticks above today’s peak. A fall below 2800.25 would invalidate the target.
