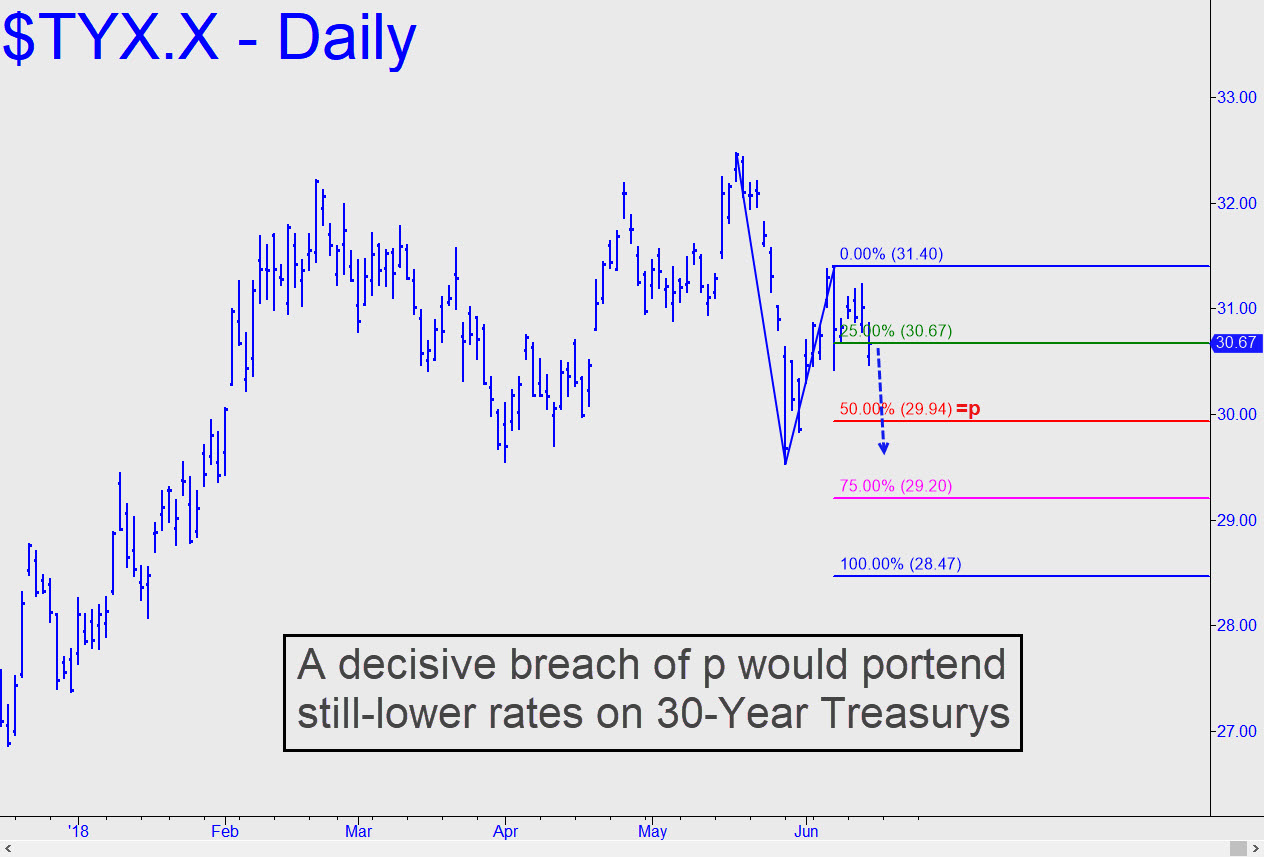
 In the tout above, I wax mildly bullish on $TNX.X, a vehicle that tracks interest rates on the U.S. Ten-Year Note. This implies that I am bullish on rates and believe they will rise, but bearish on the Note itself, because its price would fall. Now, with an insightful nudge from my friend Doug Behnfield, a Boulder-based financial adviser whose thoughts have been featured here many times, I am persuaded to take a closer look at both vehicles. Lo, the chart of $TYX.X, which tracks rates on the U.S. 30-Year Bond, reinforces a somewhat different conclusion — i.e., that long-term rates are headed lower, perhaps significantly so. (To embrace this point of view would make me a bond bull, since bond prices would rise rise as yields fell.) From a technical standpoint, the crucial number here is 2.994%. Rates look very likely to fall at least to this level. But if they easily trounce that ‘Hidden Pivot’ support, trading 2.970% or lower intraday, or if rates close for two consecutive days beneath the pivot, I’d infer that they are headed down to at least 2.847%. At that level, the same observations would obtain: a quick and decisive breach would portend still-lower rates. I’ve set an alert and will keep you closely apprised, so stay tuned to this tout if you care. _______ UPDATE (July 15): I’ve adjusted my downside target to 2.874%, which is where I now expect rates on the 30-year to fall over the near term. The revision uses a one-off ‘A’ and yields a 3.007% midpoint support that precisely caught an interim low low. (It also offered a fine ‘mechanical’ short on the June 22 rally back up to the green line). Here’s the new chart. _______ UPDATE (July 25, 8:18 p.m.): TYX is showing rather more pluck than I had imagined earlier. I will update my outlook with specific details shortly, so stay tuned.
