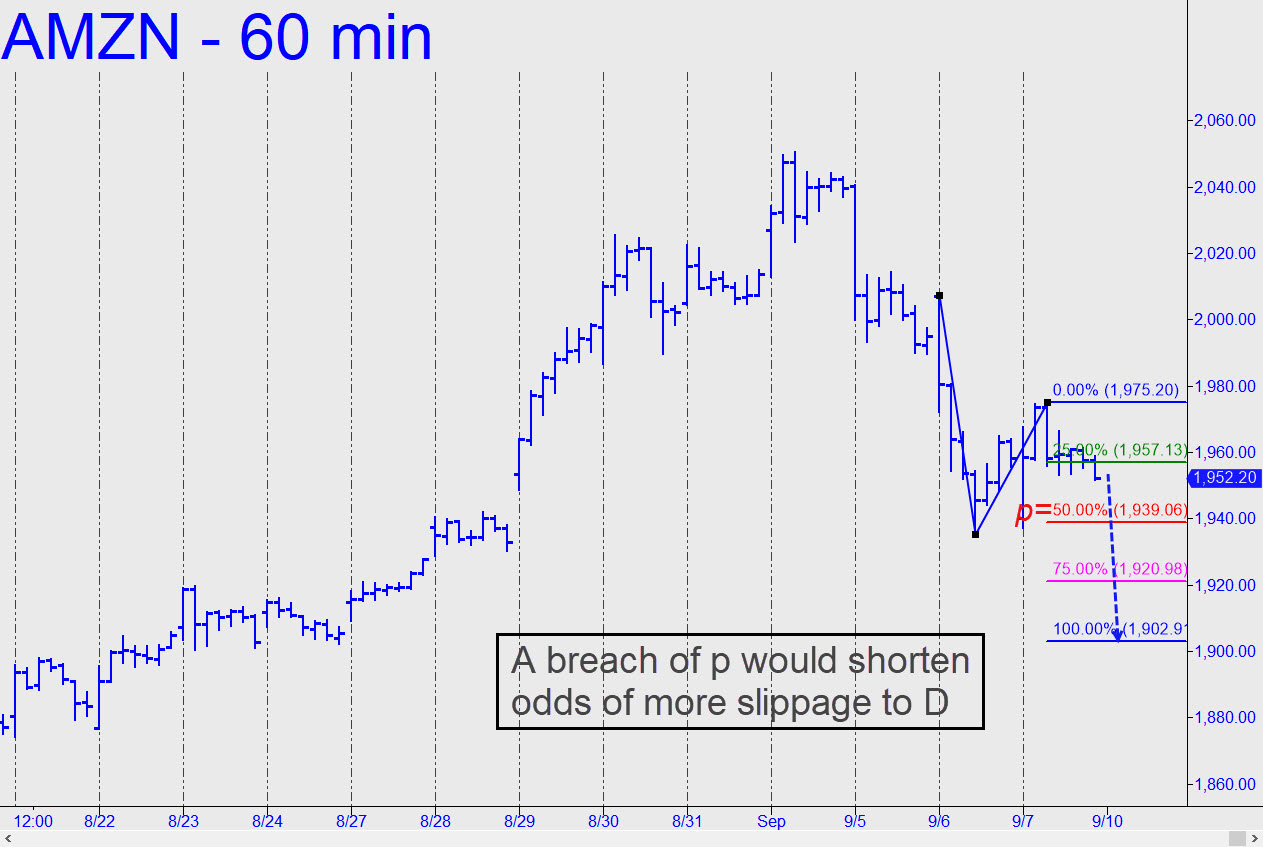
 AMZN has come down hard after topping $12 above the $2038 target flagged here well in advance of the turn. Although Friday’s sloppy action tripped a theoretical sell signal, the move has yet to touch the red line where downside to the 1902.91 target would become an even-odds bet. Traders should consider fading an ‘up’ opening with far-out-of-the-money puts, but don’t risk much on this gambit, since you would not be initiating the trade ‘mechanically’ at a Hidden Pivot level.______ UPDATE (Sep 11, 4:52 p.m.): DaBoyz opened the stock significantly lower, spring-loading a short squeeze that allowed them to sell stock for a much as $71 more than they’d paid for it hours earlier. The rally exceeded two ‘external peaks on the hourly chart, implying that shorts are in for another likely drubbing on Tuesday. However, the stock will need to surpass the 2014.44 peak labeled in this chart to refresh the ‘impulsive’ energy of the hourly chart._______ UPDATE (Sep 16, 5:07 p.m.): AMZN has tripped a weak ‘mechanical’ buy signal on Friday’s pullback to x=1966.70. Ordinarily we require these corrections to come from midway between p and p2, but this is AMZN, after all, and the A-B impulse leg that can help us determine the appeal of a mechanical trade was quite strong. However, to avoid the nearly $5000 entry risk implied per round lot, I’d suggest substituting a ‘camouflage’ set-up for the buy signal already triggered. This will mean waiting for an ABC entry pattern on a chart of lesser degree. I’ll recommend using the one-minute chart for this purpose, predicated on the stock hitting a minor correction low tied to a distinctive pattern. _______ UPDATE (Sep 17, 10:38 a.m.): The stock tripped a ‘camo’ buy on the one-minute chart at 1966.56 on Friday (2:40 p.m.), of which 3/4 of the position would have been exited at p=1967.71 and D=1970.00. This occurred before my weekend update went out, however. As a practical matter we would not have held onto the remaining, one-lot position over the weekend.
