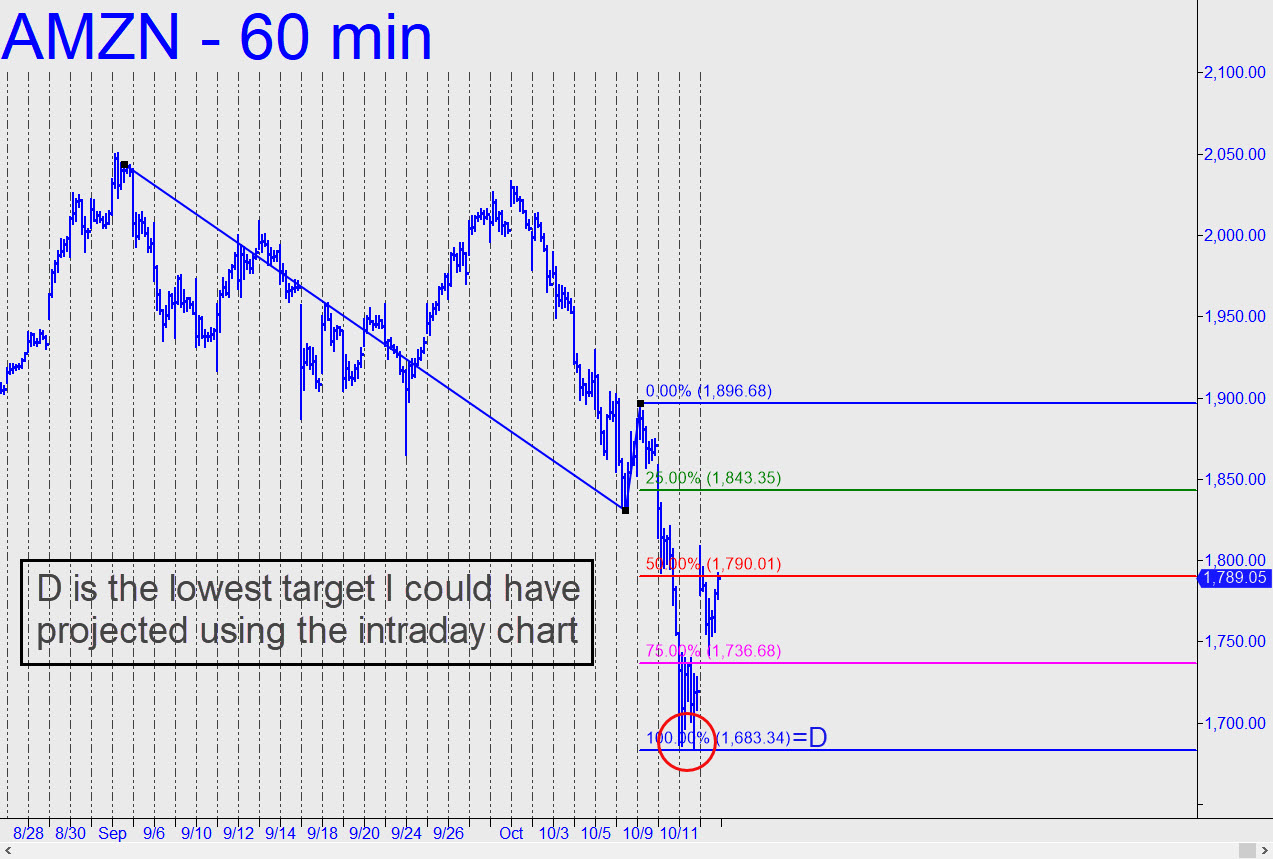
 AMZN has bounced moderately so far from a 1685. 10 low that was less than $2 from the lowest target I could have projected using the intraday chart (click here for graph). The low sits roughly midway between two important lows made in June and July, respectively, at 1646 and 1739. This is an odd and uncomfortable place for the turn to have come, since we might have expected the buying to materialize close to the lower number, which would have been perceived as an important support. Under the circumstances, I would expect the stock to relapse and test the low, although we should give buyers wide berth as they bounce the stock who-knows-how-high. The lesser charts point toward a minimum 1866.38 (15-minute, a=1685.10 on 10/11), and a rally to that Hidden Pivot should be considered a done deal if AMZN can close above p=1804.46 or trade decisively above it intraday._______ UPDATE (Oct 15, 9:49 p.m.): Today’s constipated price action slightly lowered AMZN’s fly-or-die threshold to 1796.00. Here’s the chart. _______ UPDATE (Oct 16, 7:41 p.m.): AMZN turned doubters into pudding with Tuesday’s relentless rally. For now, use the 1858 Hidden Pivot shown in this chart as a minimum upside objective.______ UPDATE (Oct 18, 11:57 a.m.): The stock has sold off hard after falling $13 shy of the 1858 target. It’s still valid, but it looks less compelling at the moment. A further fall to X=1765.19 would trip a weak ‘mechanical’ buy signal.
