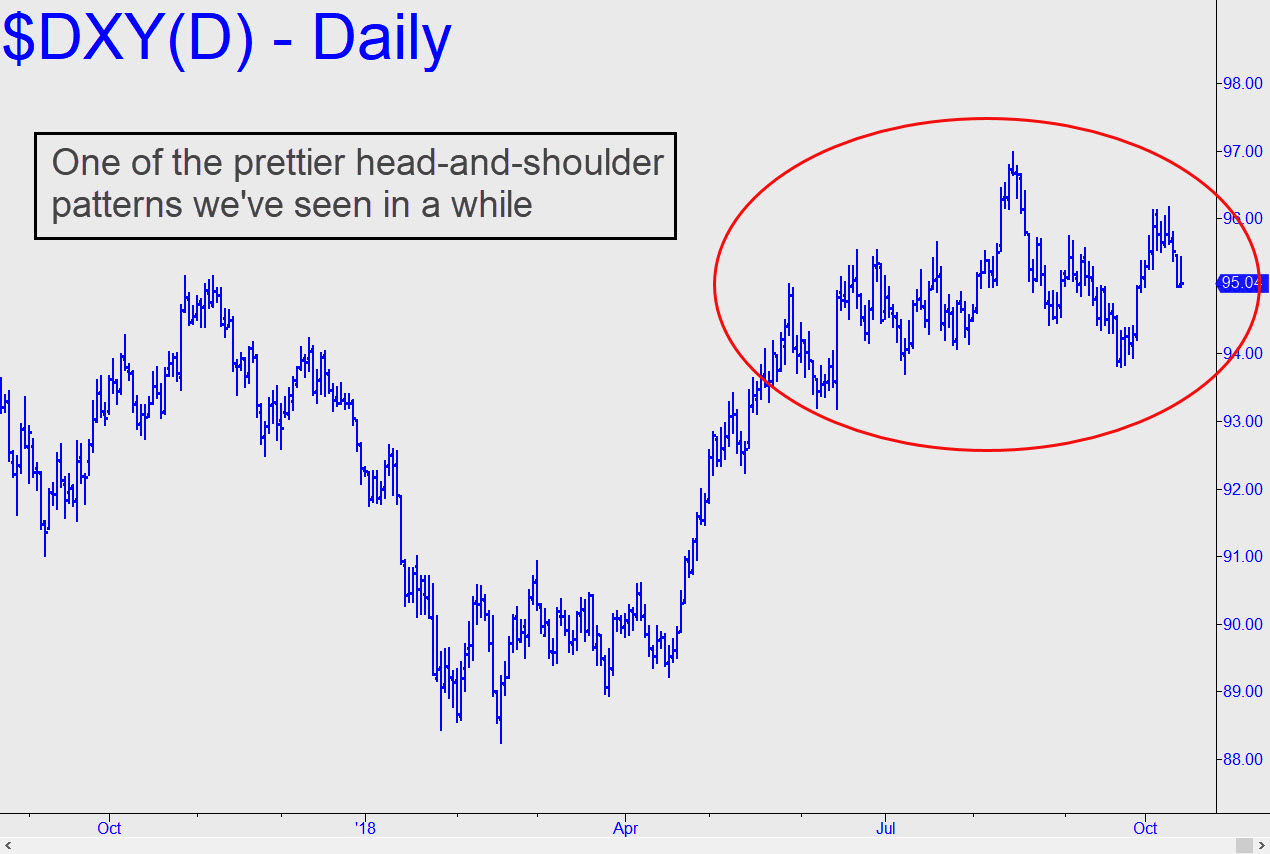
 I tend to tune out head-and-shoulder patterns because they are everywhere one wishes to see them. However, the one shown in the inset is an impressive specimen and dangerous to ignore. Since it implies an eventual fall in the Dollar Index to as low as the high 80s, I’ll need to factor that possibility into an otherwise resolutely bullish outlook that has obtained here for several years. Charts aside, I’ve been bullish on the dollar because, despite talk of the world ganging up on it to create an alternative reserve currency, no other money on Earth is sufficiently scaleable to fill the bill. The U.S. dollar is the only game in down, and that’s why I’ll take the bearish H&S pattern with a grain of salt. Additionally I’ll note that the weekly chart is tracing out a much bigger H&S pattern that goes back to 2014. If it were to play out in textbook fashion the dollar could be headed into a major bear market that would it down into the high 70s._______ UPDATE (Oct 23, 11:04 p.m. EDT): If bulls can push this vehicle just 1.75 to 2.00 points higher, it would negate the bearish head-and-shoulders pattern noted above._______ UPDATE (October 25, 9:38 p.m.): This chart shows how the last few days have all but negated the bearish head-and-shoulders pattern that had been forming since May. It suggests that the 98.99 target that was in play in June is still very much in play.
