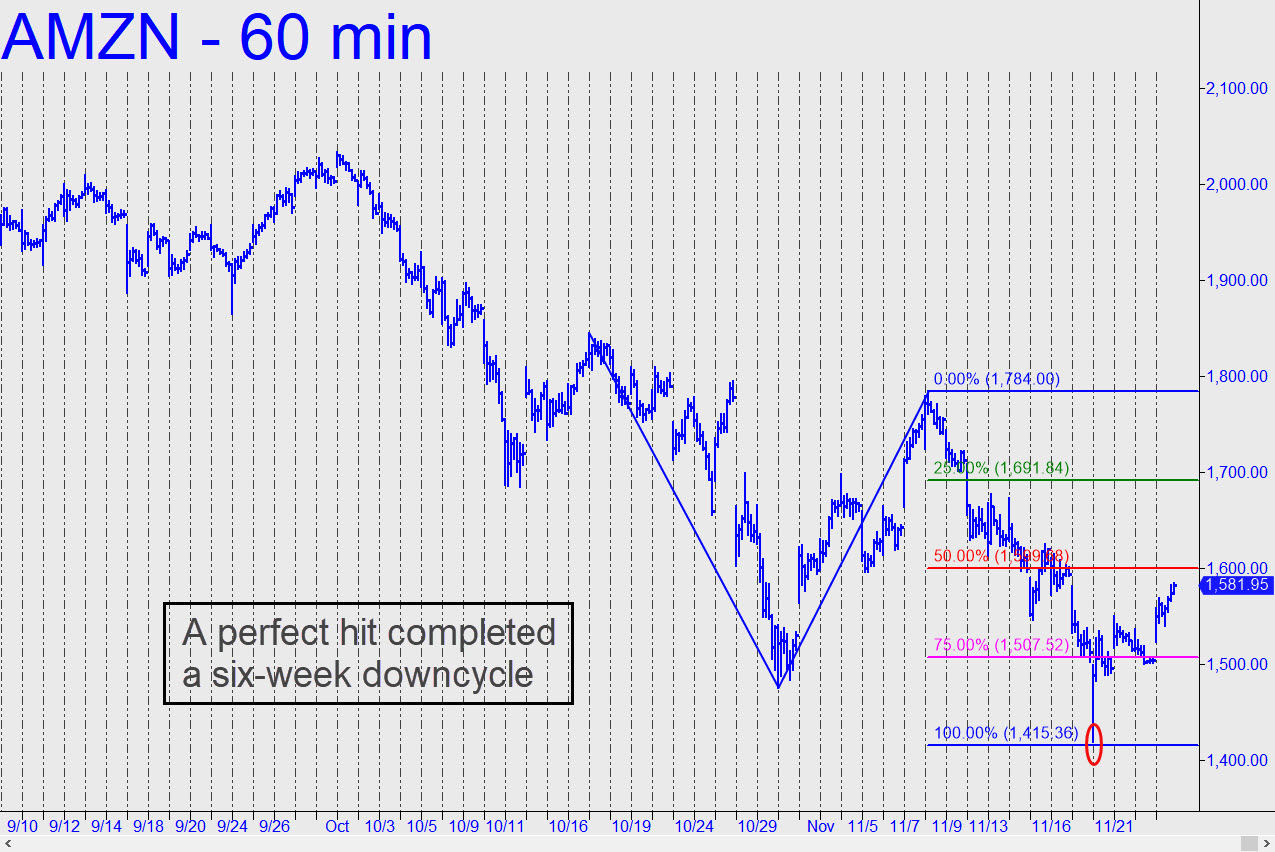
 AMZN’s 1420.00 low last week came within a hair of a 1415.36 target that had been nearly six weeks in coming. That suggests that the bounce, assuming it is just a correction, could take at least 2-3 weeks to play out. We shall see. In the meantime, the rally has exhausted all legitimate targets on the hourly chart and will need to surpass another external peak to generate a fresh impulse leg. The nearest lies at 1624.82 and should pose no problem, given the viciousness of Monday’s short-squeeze opening bar. AMZN is nearly as important a stock-market bellwether as AAPL, and the two must move in tandem if they are to summon the animal spirits necessary to keep the broad averages climbing a formidable wall of worry. It now includes fading housing and auto sectors, a serious downturn in the economies of China and Germany, and a possible peak in corporate earnings._______ UPDATE (Nov 28, 6:08 p.m. ET): There’s no point in pussyfooting, so I’ve chosen a very gnarly but nonetheless plausible pattern that yields the most ambitious rally target possible on the lesser charts: 1775.07. A stall at p=1688.15 would confirm it. Here’s the picture. _______ UPDATE (Nov 29, 9:50 p.m.): Amazon retreated $15 after exceeding our 1688.15 benchmark by a whisker. My outlook remains unchanged._______ UPDATE (Dec 2, 6:30 p.m.): The 1775.07 rally target remains valid, but we can break the move into smaller, more easily tradable segments by focusing on the lesser target at 1733.31 shown here. A decisive push past p=1693.20 would all but clinch it, and a pullback from our ‘sweet spot’ could set up a ‘mechanical’ buy. Tune to the chat room for real-time guidance._______ UPDATE (Dec 3, 10:35): When I proffered the 1775.07 target, I considered it very ambitious, but I never imagined that it would be achieved with lightning speed. The stock’s handlers are obviously hell-bent on recouping Christmas bonuses that are pegged by and large to the performance of just two stocks: AMZN and AAPL. AMZN exceeded our target only slightly on Monday, but once the stock breaks free of it, look for the rally to continue to the 1881.50 target shown here. A stall at the 1818.50 midpoint pivot would confirm the pattern._______UPDATE (Dec 5, 10:45 p.m.): The stock has plummeted from a high at 1778 that fell somewhat shy of our ‘break free’ benchmark. That it did so without exceeding a key ‘external’ peak at 1784 from 11/8 is another cautionary sign. Let’s see if the selloff takes a bounce off p=1597.62, a midpoint Hidden Pivot support that is my minimum downside objective from here (daily chart, A= 1784.00 on 11/08)._____ UPDATE (Dec 6, 5:53 p.m.): The low of today’s plunge came at 1609.85, about $12 above where we’d expected it. This is ostensibly bullish, but there must be a better explanation. If the bounce hits 1794.82, exceeding an ‘external’ peak on the daily chart, we’ll be forced to concede that the downtrend’s failure today to reach the midpoint support actually was bullish.______ UPDATE (Dec 7, 3:17 p.m.): It wasn’t, so we don’t have to do any conceding. Phew, what a relief!
