
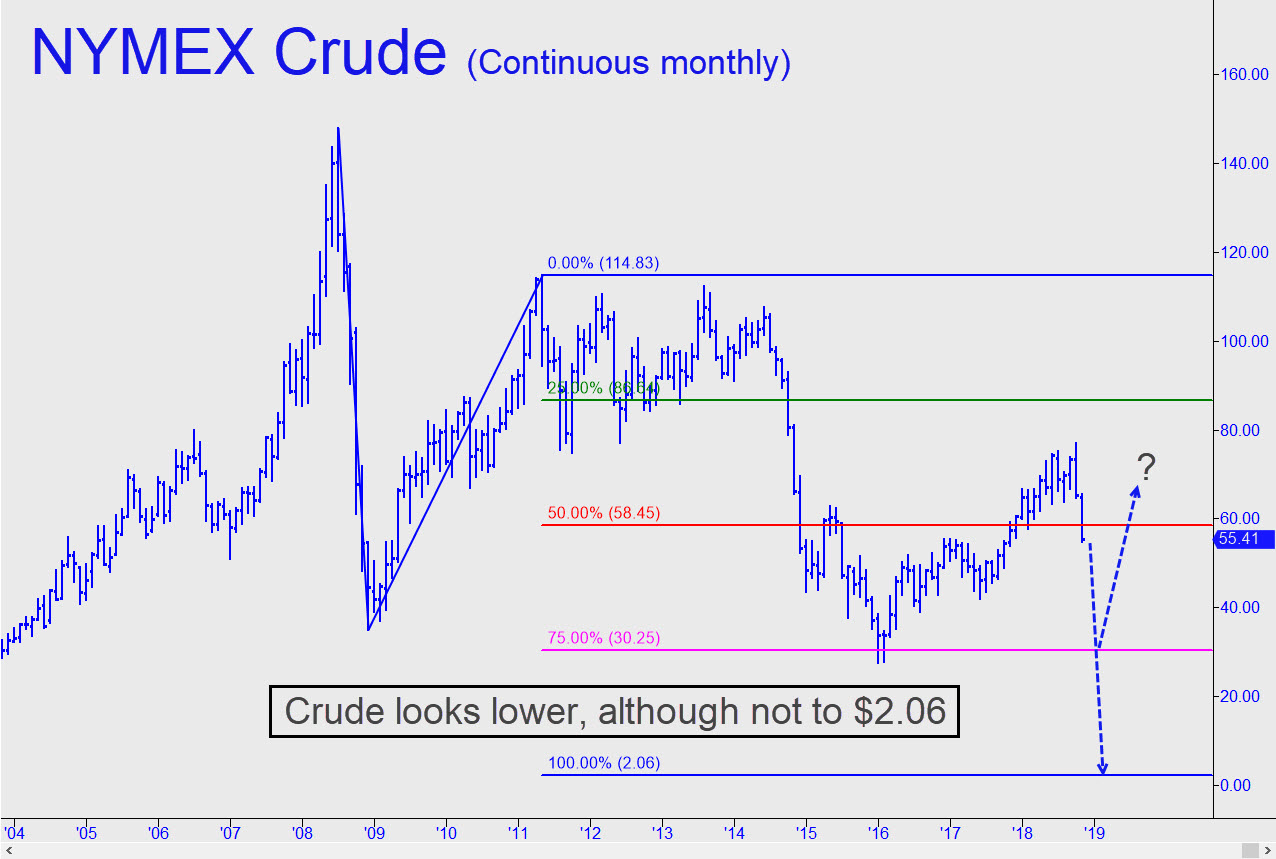
 Crude’s price fluctuations are a circus act that I’ve watched with diminishing interest over the years. It’s easy enough to predict short-term swings with sufficient accuracy to make money at it, as Rick’s Picks subscribers who traded NYMEX futures and energy ETFs yesterday would be happy to attest. But paying diligent attention to the constant barrage of supply-and-demand spin that drives the big moves could make a guru’s head spin. On some days, the Saudi princes seem out-of-sync with their own PR flacks, promising plenty of oil when their gallimaufry of useful idiots are spreading a ‘tightening’ story like some strain of flu.
The China Factor
I’ve added this oil tout to today’s list nonetheless because I was curious about where prices might actually be headed. Clearly, not to the 2.06 target shown in the chart. But it’s still a good number to use to get the trend right, suggesting as it does that prices will continue to be pulled sharply lower by global forces that are only now becoming recognized. Near the top of the list would be the threat of a global slowdown. It has gotten a good start from China, whose already-serious recession has become an important factor in crude’s dive since early October. Prices peaked around $77 a barrel, but they were at $55.40 when the regular session ended on Tuesday. This equates to a decline of 28%. We shouldn’t be surprised to see quotes go even lower in the weeks and months ahead, possibly to the $30.25 ‘secondary Hidden Pivot’ shown in the chart. If that were to occur we could conceivably witness that rarest of miracles — i.e., lower prices at the pump. But I wouldn’t hold my breath. We should also allow for the remote possibility that forces unknown — war in the Middle East? — could reverse the current decline, pushing a barrel to as high as $90. That’s in the chart as well, albeit as an outlier tied to the upward correction from around $30 begun nearly two years ago._______ UPDATE (Nov 15): The January contract has an unfulfilled downside target at 56.35 that will remain viable as long as 57.18 is not exceeded to the upside first._______ UPDATE (Nov 18, 5:08 p.m.): The futures ratcheted tediously higher last week without exceeding any external peaks on the hourly chart. This left a bearish picture unchanged and an intraday low that came within 12 cents of the 56.35 target proffered above. Now, if the January contract falls anew, decisively exceeding the 55.91 midpoint Hidden Pivot support shown in this chart, it would put the pattern’s 53.66 target in play._______ UPDATE (Nov 20, 9:48 p.m.): Crude got savaged yet again, eventually turning from a low at 52.77 that lay 89 cents beneath the target flagged above. The overshoot is sufficient to imply that still lower prices are coming. However, an upward correction would get legs if buyers can close the January contract above 54.98, equal to an ‘external’ peak made Tuesday on the way down._______UPDATE (Nov 25, 5:07 p.m.): Sellers have continued to obliterate Hidden Pivot supports as fast as I can calculate new ones. Use a 49.23 pivot as a minimum objective for now, but be prepared for more slippage to 47.28 if it gives way. Here’s the chart, with a gnarly pattern that I’m not wild about but which will have to suffice for now.