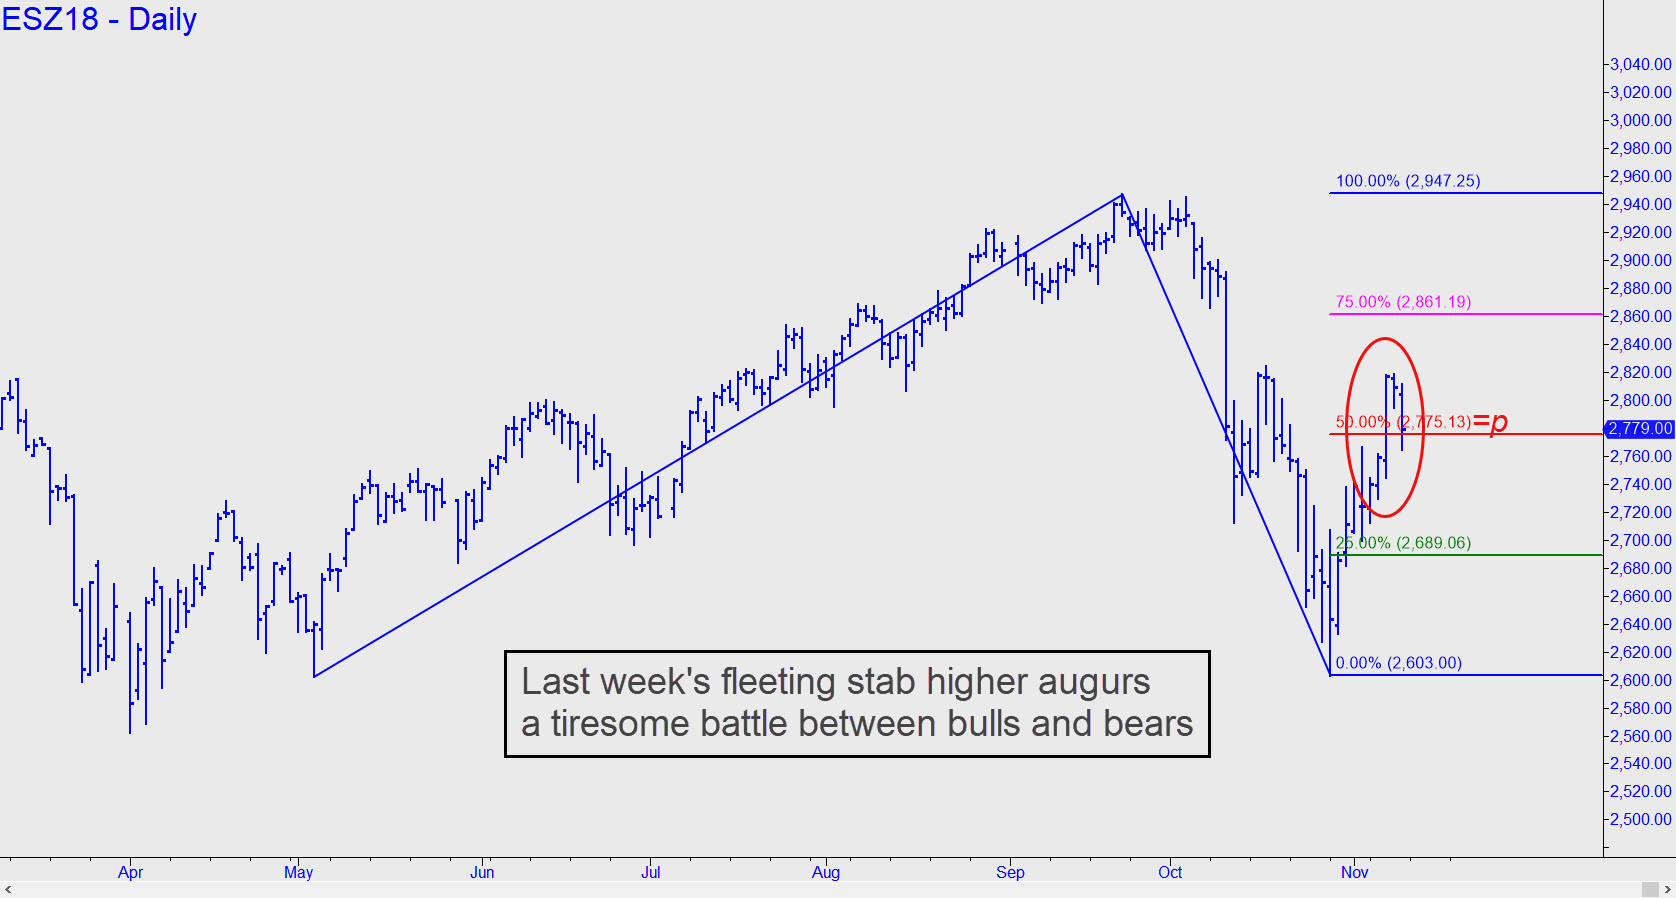
 Last week’s tentative rally has made a tiresome battle between bulls and bears more likely over the next 2-3 weeks. My hunch is that the bulls will prevail, eventually pushing the futures to a test of all-time highs near 2950 recorded in late October. I am leaning bullish because the rally decisively exceeded a 2775.13 midpoint Hidden Pivot resistance shown in the chart as a red line. However, the surge failed to exceed a key ‘external’ peak 2824.25 recorded in mid October. This somewhat timid price action has possible implications for the future, since it may foreshadow a bull trap the next time the E-Mini S&Ps are in record territory, assuming they get there. This may sound a little crystal ball-ish, but it is simply a straightforward application of Hidden Pivot rules that have been tested and corroborated many thousands of times._______ UPDATE (Nov 12, 8:31 p.m. ET): The pattern shown tripped a ‘counterintuitive’ short at the green line, putting in play a 2707.13 Hidden Pivot midpoint support that is likely to generate a bounce that might be tradeable. If not and the futures bust the support easily, look for more slippage to as low as 2596.50 over the near term. _______ UPDATE (Nov 14, 9:46 p.m.): Today’s moderate selloff missed the minor D target at 2679.50 shown in this chart. It remains viable, but if the futures reverse without hitting it and go on to exceed 2755.75, bulls would be back on the offensive, with a shot at 2871.00. Alternatively, a decisive downside breach of D would leave the 2596.50 target given above in play._______ UPDATE (Nov 15, 7:47 p.m.): The futures tripped a theoretical buy signal for a shot at 2760.00 or perhaps even 2848.75! Check out my 14:21 post in the ‘Saloon’ for a bullish trading idea that could help dramatically reduce the entry risk. Here’s the relevant chart.
