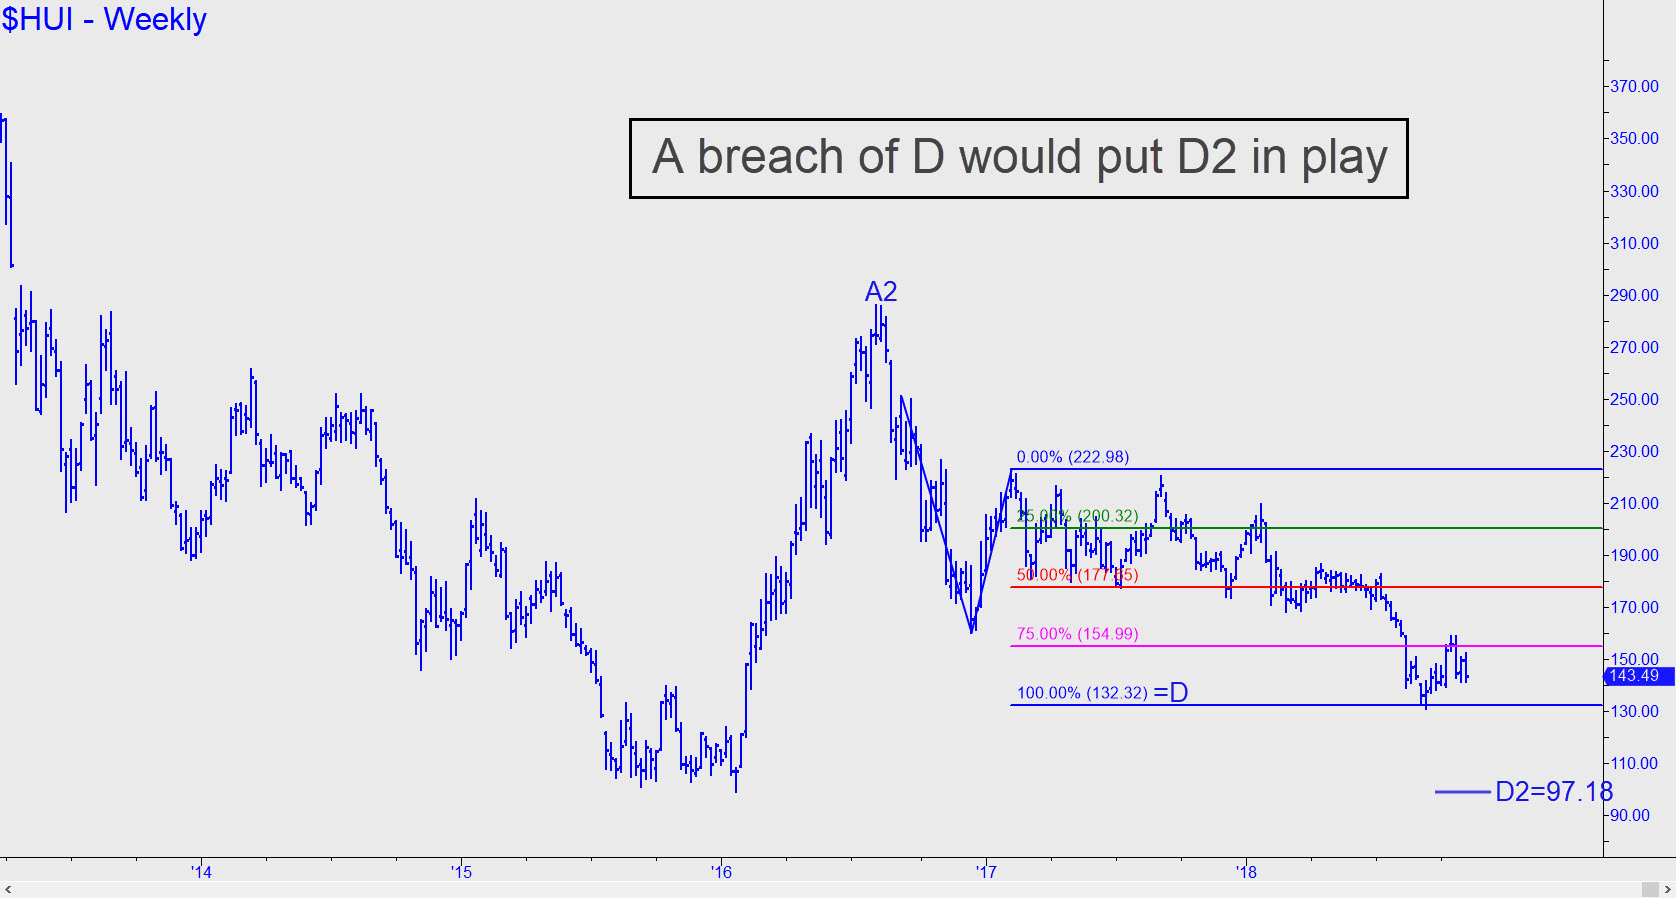
 If the Gold Bugs Index were to slip beneath the 132.32 Hidden Pivot support shown in the chart, it would put a 97.18 target theoretically in play. This worst-case number is calculated by shifting the point ‘A’ high of the pattern up to 2016’s peak at 286.05. Such a dire scenario is by no means assured, since the downtrend has so far been arrested at the p2 secondary pivot of the larger pattern — a logical place for a correction to end. However, it would take an upthrust exceeding 162.44, a 13% move from here, to turn the daily chart unambiguously bullish. The number 162.44 is equal to a look-to-the-left peak recorded on August 9 before HUI went over the falls._______ UPDATE (Nov 18, 5:07 p.m. ET): Buyers caught fire last week, rescuing the Gold Bugs Index from a punitive selloff that had threatened to test September’s abysmal lows near 130. Bulls will face a key test just above, however, at the 151.16 midpoint resistance shown in this chart. If they can penetrate it decisively, or close above it for two consecutive days, that would put the 165.06 target well in play._______ UPDATE (Nov 26, 5:41 p.m.): The rally has laid an egg after pushing slightly past the 151.16 midpoint pivot flagged above. A two-day sell-off has not doomed the effort, but bulls will face a crucial test if HUI pulls back to 144.20, since that is where a so-so ‘mechanical’ buy signal would be triggered. Here’s the chart._______ UPDATE (Nov 27, 8:27 p.m.): The so-so ‘buy’ signal has triggered, but we’ll ignore it because bulls have fared poorly in this vehicle when seizing such opportunities. Come what may, our gain for the time being will lie in the learning process.
