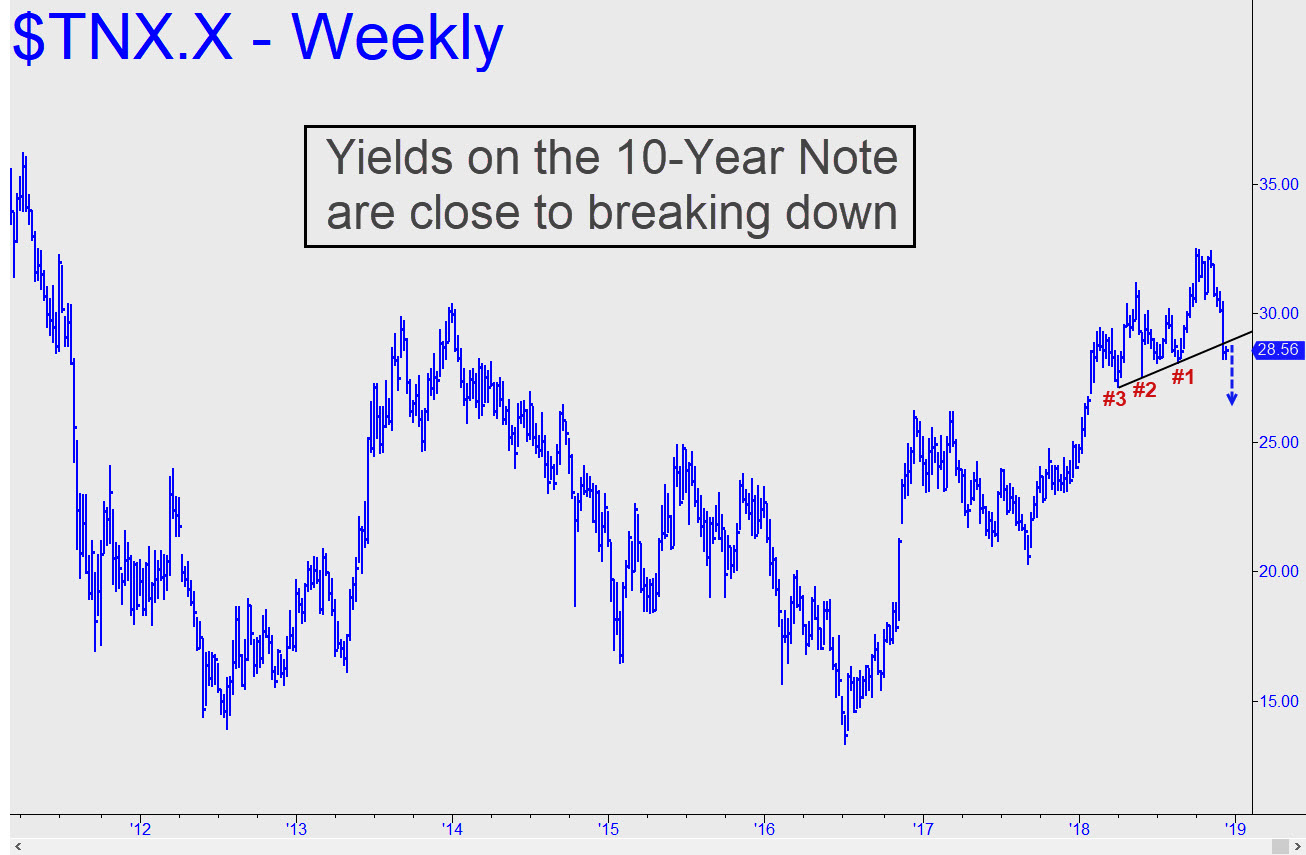
 Odds that long-term rates have made an important top increased with the recent plunge in yields beneath the trendline shown in today’s chart (see inset). The U.S. Ten-Year Note fell to 2.826% last week, down from a high a month ago near 3.25%. The decline narrowly missed exceeding a key low at 2.808% (#1) recorded in August, but if and when that happens it would generate an impulse leg of weekly-chart degree that could weigh on rates in 2019. And if the downtrend were to exceed two prior ‘external’ lows shown in the chart at, respectively, 2.759% (#2) and 2.717% (#3) without an upward correction, that would shorten the odds even further that long-term rates have topped. _____ UPDATE (Jan 2, 6:03 p.m.): Some of you may have wondered why I reactivated a tout originally published on Dec 10. I had intended this update, with an immediate downside target of 2.633%. Let’s see what kind of bounce we get._______ UPDATE (Jan 3, 10:24 a.m.): Plunging yields didn’t even pause at 2.633%, so look for more slippage to at least 2.505%. Here’s the chart._______ UPDATE (Jan 28, 6:01 p.m.): The rally in yields to a recent high at 2.799% looks corrective on the daily chart. Since then, TNX has tripped a sell signal to at least 2.617%. As always, price action at the midpoint pivot is likely to be illuminating concerning trend strength and the bigger picture. _______ UPDATE (Feb 5, 8:06 p.m.): The bounce we were expecting has come from a recent low at 2.628%. Now, if the midpoint support just beneath that low gives way, more slippage to 2.436% would become likely. The target will remain viable as long as C=2.799% has not been exceeded to the upside.
