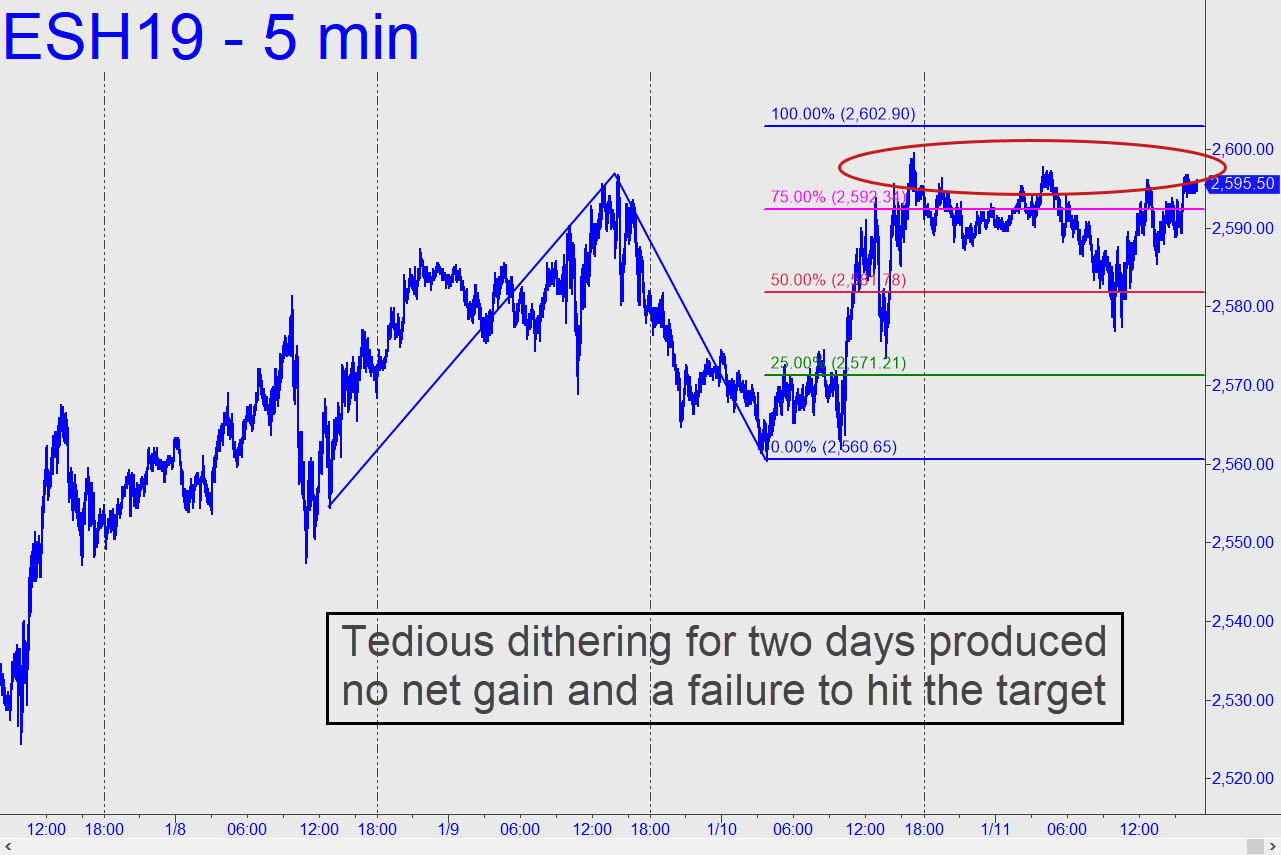
 When the week ended, the E-Minis had struggled unsuccessfully for two days to achieve a modest target inches above their intraday highs. This is distributive price action, although we should allow for the possibility that whatever was weighing on traders’ febrile brains on Friday will conveniently have been forgotten when the new week begins. The hourly chart remains bullish in any case and points most immediately to 2609.75 as the next point of resistance. This target is sufficiently clear and compelling that I will suggest shorting there with a stop-loss as tight as 1.00 point — but ONLY if you have been long for at least a portion of the ride up. If the stop is hit, raise your sights to a minimum 2632.75, yet another Hidden Pivot resistance that promises to show precise stopping power._______ UPDATE (Jan 14, 9:25 a.m.): The rally has reversed overnight, although its 2632.75 target will remain valid in theory until such time as C=2560.50 is exceeded to the downside. Here’s the chart. _______ UPDATE (Jan 15, 12:42 p.m.): And here’s yet another chart, since I am raising my minimum upside projection for the near term to 2638.75. Expect it to show precise stopping power.
