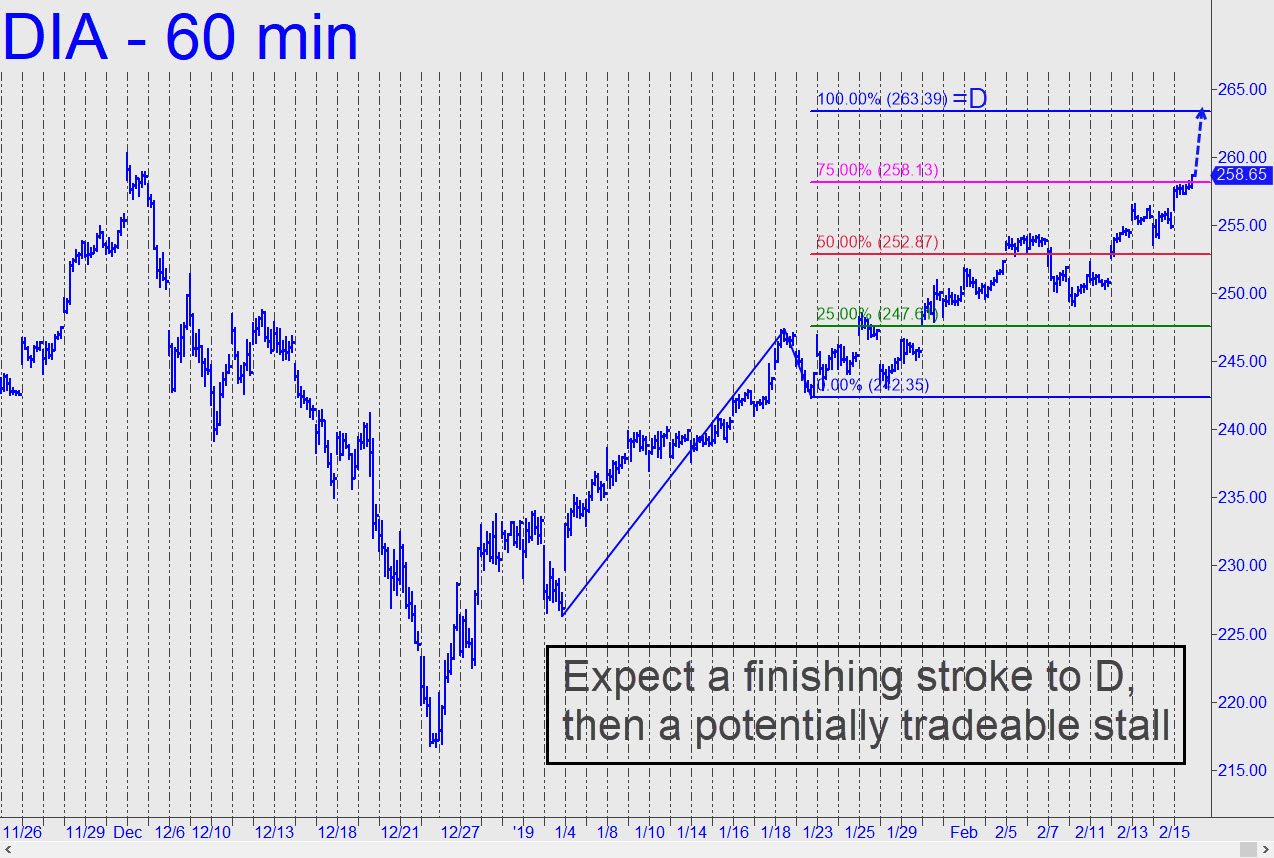
 Today’s chart shows a rally target at 263.39 that looks like a strong bet to be achieved, probably within 3-4 days. It is somewhat higher than the corresponding target at 25,998 that I’ve flagged for the Industrial Average. Although you should monitor the latter for a possible stall, this Hidden Pivot looks more likely to nail the top — or at least “a” top, since we should be open to the possibility that the stock market will flout a darkening economic picture and continue to rise for no good reason.______ UPDATE (Feb 26, 11:42 p.m.): This is taking too long, but yes, the rally target given above is still valid. _______ UPDATE (Feb 28, 9:54 p.m. EST): It is mildly bearish that DIA has turned down after peaking a point shy of the 263.39 target given above. This vehicle will fall most immediately to 257.69 if sellers crack the 259.06 midpoint support. (Click here for chart.) The target will work for tightly stopped bottom-fishing, but we shouldn’t go full-bore because the hidden pivot coincides with a structural low at 257.50 recorded a week ago. If the pivot is hit in the first two hours of the session, use expiring 258 calls to play for an immediate bounce. Notice that a breach of the 257.50 low could set up a ‘counterintuitive’ buy as well, but its usefulness would depend on when in the session this occurs.
