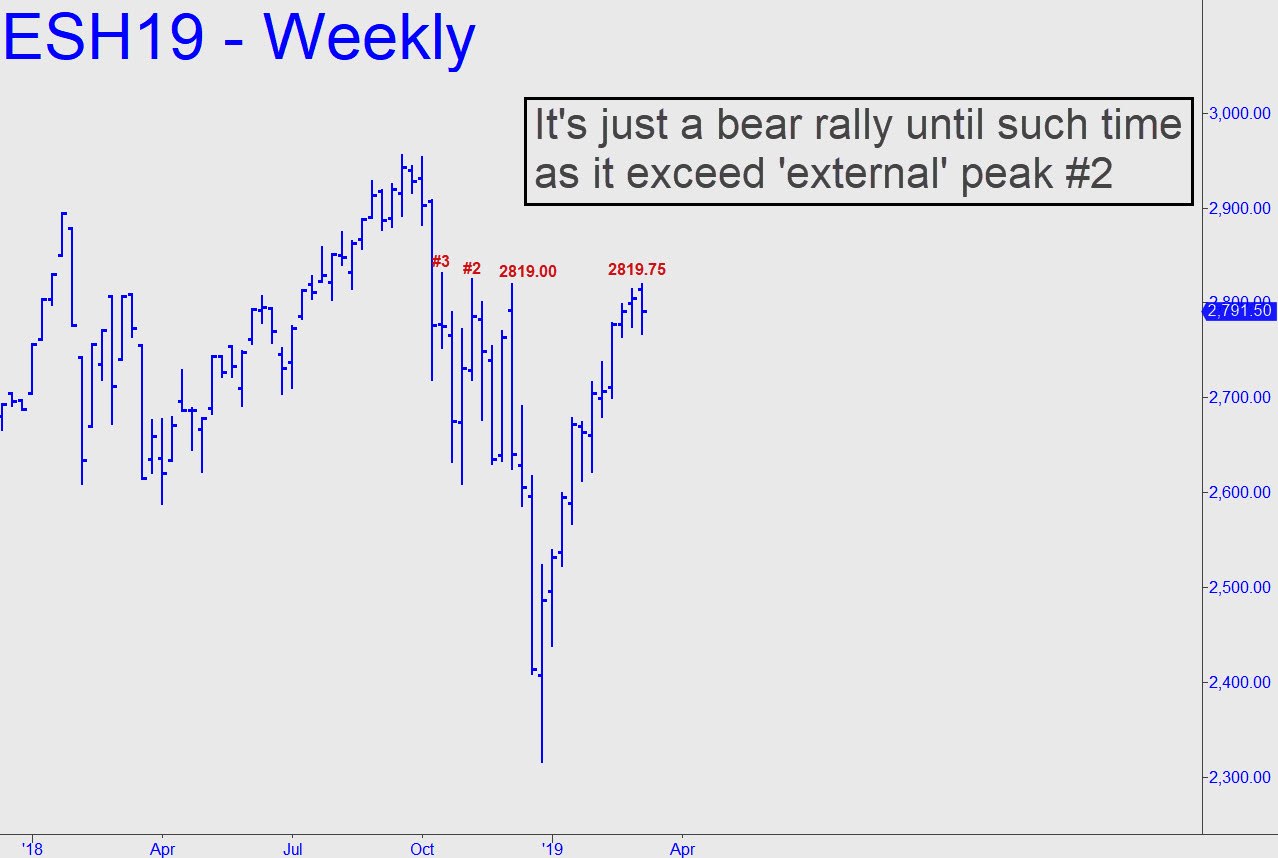
 Today’s chart takes the long view while lending authority to the possibility that the crazed leap from late December’s lows has been just a bear rally. It would have to surpass ‘external’ peak #2 to qualify as impulsive on the weekly chart, and we shouldn’t presume in the meantime to know how things will turn out. (Full disclosure: I hate the market so much that even if the S&Ps were to hit new all-time highs, I would still be very suspicious of a bull trap.) However vexatious the long-term charts might be, getting the lesser charts precisely right is as easy as shooting fish in a barrel. Accordingly, I’ll recommend bottom-fishing p=2773.75 (corrected) with a 2774.00 bid, stop 2772.75 stop-loss. The order can stand only if the futures have traded no higher than 2799.00. On the 15-minute chart, you can find the pattern starting with a=2818.00 on 3/4 at 9:45 a.m. _______ UPDATE (Mar 6, 8:44 p.m. ET): The trade was stopped out for a theoretical loss of $62 per contract when a clear and compelling midpoint support showed no resistance to the downtrend. This means the futures are now very likely to fall to at least D=2748.50. However, the descent has been tortuously slow and choppy, so I’ll suggest moving to the sidelines. It is surprising that bears were unable to bury this vehicle Wednesday, since there seems to be almost no buying interest other than from short-covering bears. Here’s the chart. _______ UPDATE (Mar 7, 10:23 p.m.): As anticipated, the March contract fell to 2748.50 — but not much farther. Buying power is still practically nil, but bears are evidently too enfeebled to seize the advantage. We’ll plan on sitting out Friday’s ‘action’ unless something interesting develops. ______ UPDATE (Mar 8, 9:55 a.m.): Looks like yet another day in which bears were depleted by overnight selling ahead of the opening bell. Stocks are weak, to be sure, but a second-wind plunge could take another hour or two to instigate.
