
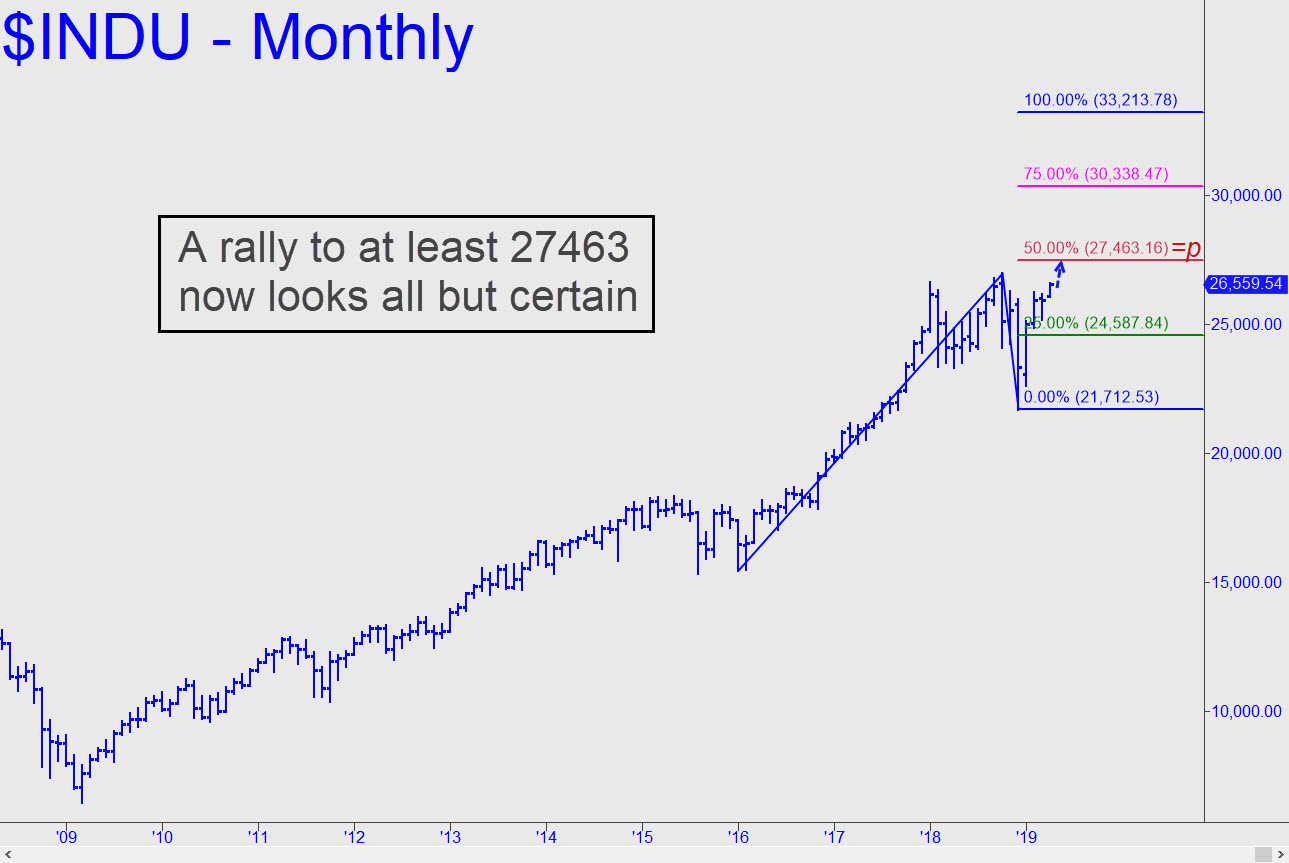
 The Dow Industrials look primed for a 900-point rally, assuming they can close for two consecutive days above Friday’s high. It occurred slightly beneath a 26,656 Hidden Pivot resistance that’s a good bet to show stopping power. However, anything above it would bring a new pivot resistance at 27,463 into focus. That’s exactly 904 points above, and it would become all but certain to be achieved if the lower number is breached decisively. Longer-term, the chart shows that the Indoos could ascend to as high as 33,213 — 6654 points, or 25%, higher — if the bullish rampage begun in January continues into 2020.
I am confident that the Hidden Pivot levels on the chart can tell us exactly how much power is pushing the aging bull market. Although the chart shows a long-term trend, it can be read exactly as we might an hourly chart. The same rules apply, and any conclusions we might draw thereof can be assumed as reliable as those we derive from the lesser charts. Indeed, the interchangeability of time frames is a crucial aspect of the Hidden Pivot Method. In this case the chart speaks so clearly that there is little room to doubt their conclusiveness. _______ UPDATE (Apr 25, 9:17 p.m. ET): The 26,656 pivot noted above has given way, although not by much. Now, if the next run-up can close for two consecutive days above the so-far high at 26,696, I’d infer the Indoos are on their way up to at least D=26,974, or 27,125 if any higher. FYI, a ‘mechanical’ buy missed triggering today by a hair, but I’ll track it anyway — from x=26,329. Here’s the chart.