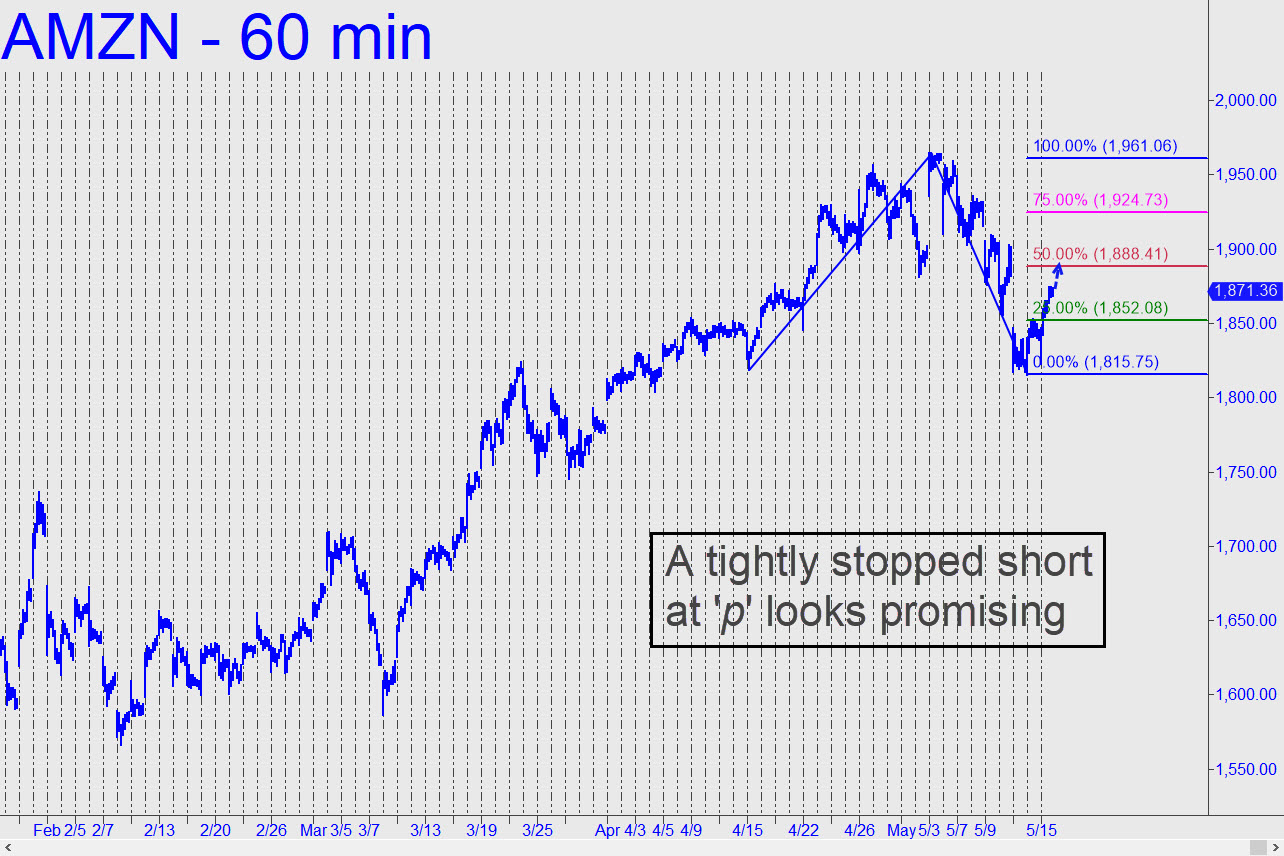
 Buyers have tripped a ‘counterintuitive’ entry at the green line, x=1852.08. The trade was and still is a very good bet to reach the midpoint pivot at at 1888.41. However, anything above that if you are long could be pushing your luck. This implies that getting short with put options at ‘p‘ will yield decent odds, provided you use a tight stop-loss. Check in the chat room if the trade gets close, since I may be able to provide real-time guidance. The reason we shouldn’t be too optimistic about the rally is that it is occurring after a failure on the last run-up to reach a well-advertised, perfectly clear target at 1982. We shouldn’t presume that the top is in for the ten-year-old bull market, but if it were it would be signaled by a trend failure such as the one I’ve noted. If this trend also fails to reach D=1961.06, it would raise the odds that significant weakness is creeping in. A failure would be signaled by a pullback below C=1815.75 without AMZN having reached 1961.06.______ UPDATE (May 16, 10:35 a.m.): Today’s take-no-prisoners short squeeze has reminded me that the 1982.86 target is still valid even though it was nearly achieved on the run-up two weeks ago. _______ UPDATE (May 19, 10:09 p.m.): If we stop believing the 1982.86 target will be reached, that’s the same as believing the 10-year-old bull market is over, finito. Perhaps. But let’s adjust our bias one small step at a time, first by monitoring price action at p=1857.70 in this chart. An easy breach of this Hidden Pivot support would put the 1797.89 target in play. _______ UPDATE (May 20, 8:32 a.m.): Just for good measure, let me mention that 1774.26 would be become the minimum downside target if 1797.89 gets shredded. It can be found by moving the point ‘A’ high up one rung.
