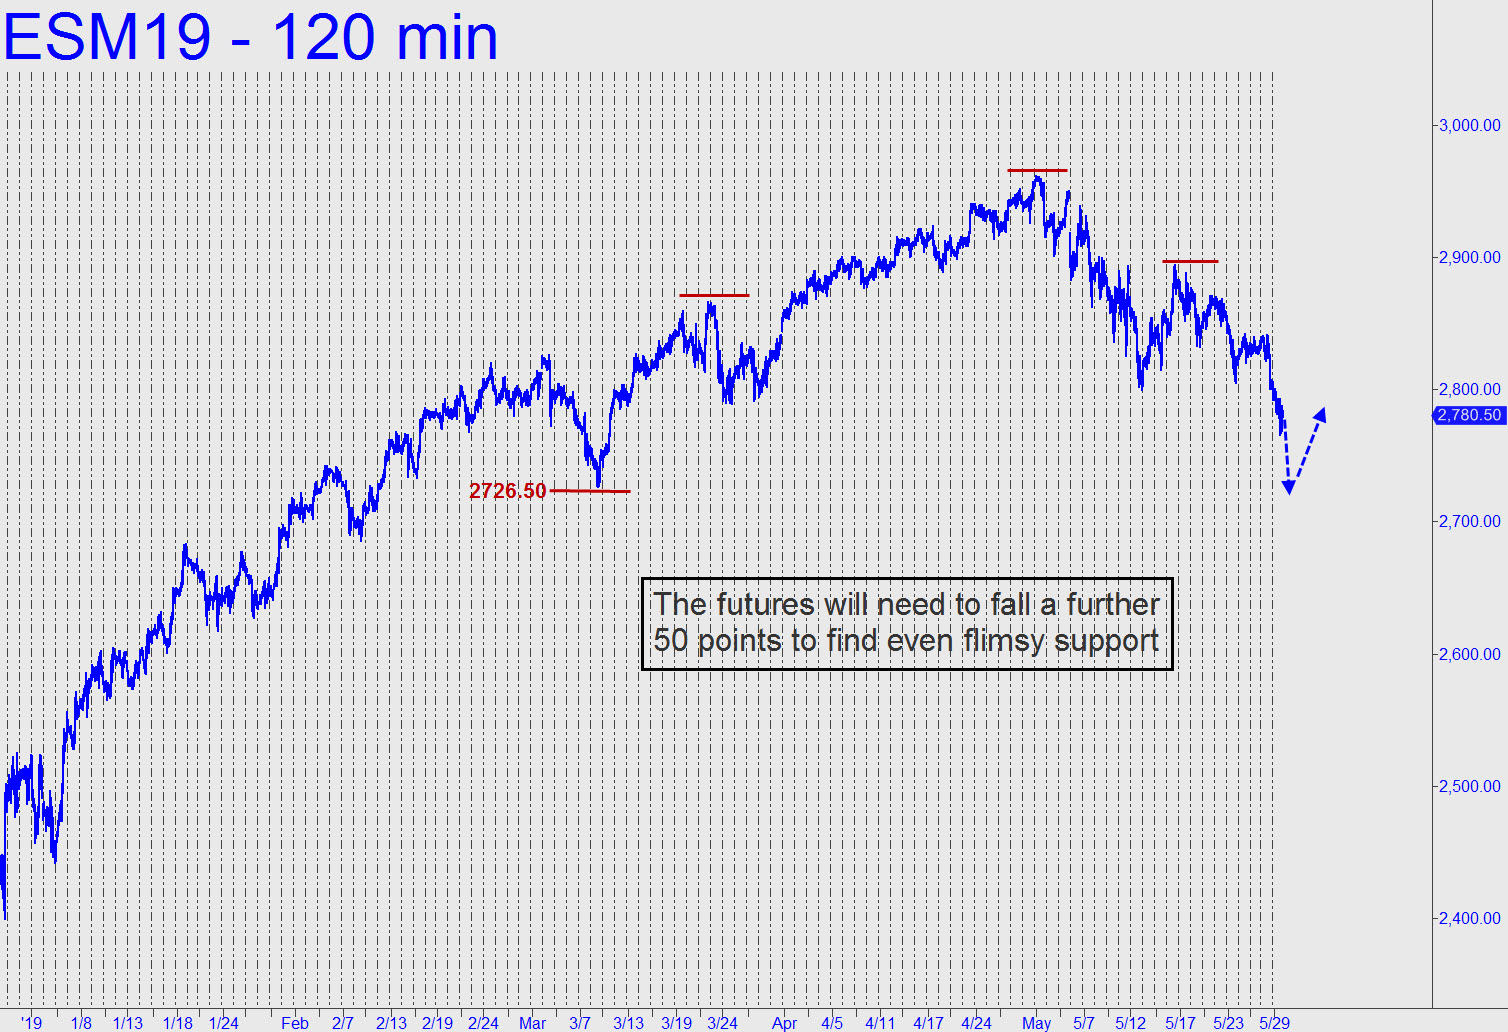
 The head-and-shoulders pattern shown implies the futures could fall at least a further 50 points in search of traction. It is a flimsy support, to be sure, created by an important low at 2726 recorded in early March. The suspicion grows that the ten-year-old bull market is over, but we’ve been there before and stocks have recovered every time. If a bear market has in fact begun, we should see it first in uptrending ABCD patterns that fail to reach their ‘ D’ targets and downtrending (i.e., corrective) abcd patterns that overshoot ‘d’. The first instance of the latter lies at 2744.25, a Hidden Pivot support that must evince a strong bounce if bulls are not about to get trounced. Concerning the rally target, I’ve proffered one at 3095 for the S&P cash index that has grown more distant and which now lies about 11% above current levels. This no longer looks like an odd-on bet, at least for the near term._______ UPDATE (May 31, 8:23 a.m. ET): An ESU19 target at 2747.00 is equivalent to the June target we’ve been using at 2744.25. Any lower would activate 2734.25.
