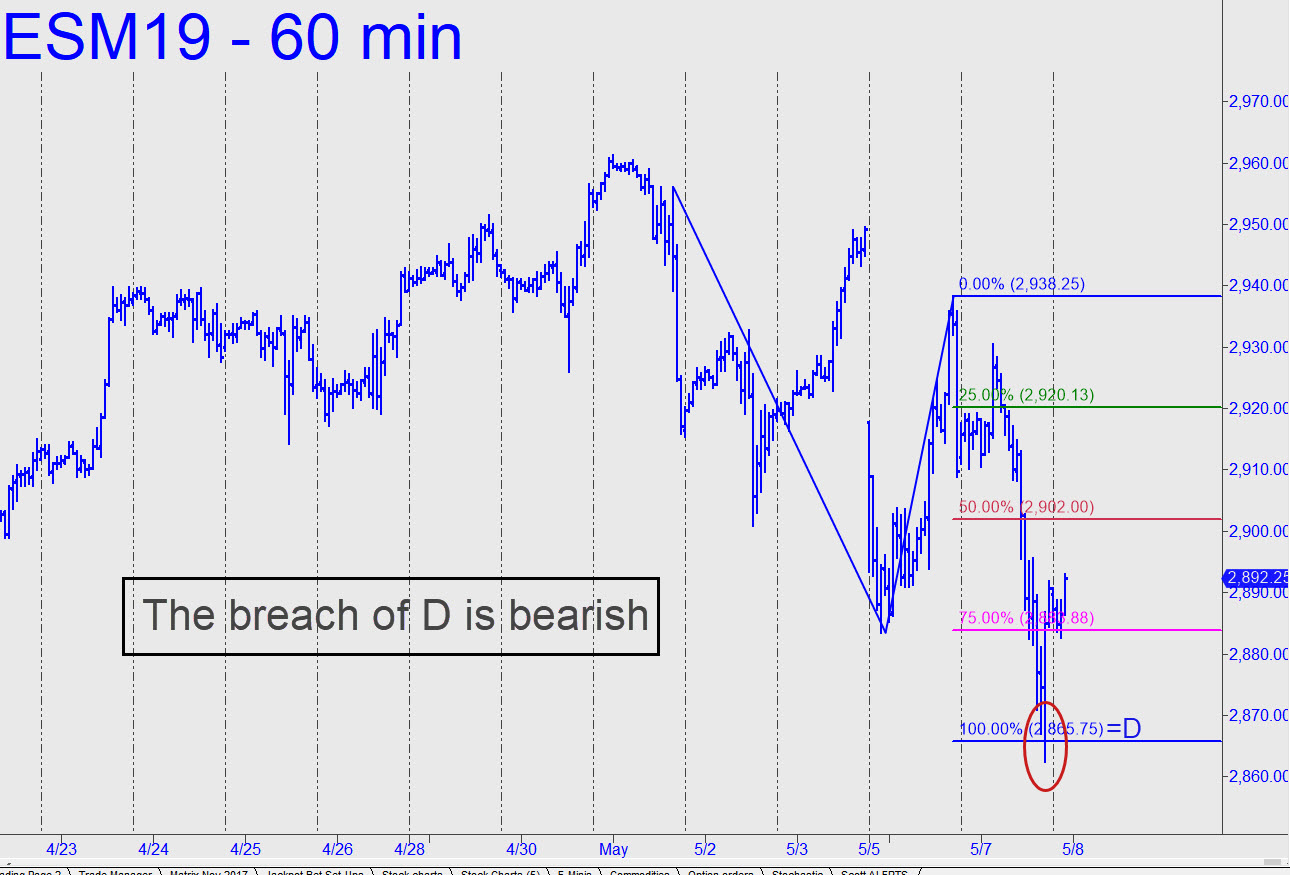
 Sellers exceeded the 2865.75 downside target shown, implying they are not yet done. The overshoot was just 3.25 points, but that’s sufficient for us to infer that the rally is corrective and therefore, at some level below 2938.25, an opportune short sale. Granted, there’s room to raise the point ‘A’ high a tad to produce a lower ‘D’ that would have precisely contained the selloff. But the one I’ve used is too clear and compelling to ignore, and that’s why I am relying on it to give me an accurate read on the dominant trend. Alternatively, however, and just in case, a thrust above C=2938.25 would be warning bears to dive for cover. _______ UPDATE (May 9, 8:06 a.m.): Weakness overnight has put a 2831.50 target in play. There’s potential for a ‘mechanical short’ to materialize if the futures rally to x=2882.50 (stop 2900.00). Here’s the chart. _______ UPDATE (May 9, 2:21 p.m.): The relapse amounted to a very nasty 50 points. Shorts panicking to get ’em back have reversed the selloff from 2836.25, five points shy of my target, recouping 70% of the day’s losses so far. I am skeptical about this rally but would become a (temporary) true believer again if it hits 2930.75. This is a tick above an interesting ‘external’ peak on the hourly chart.
