
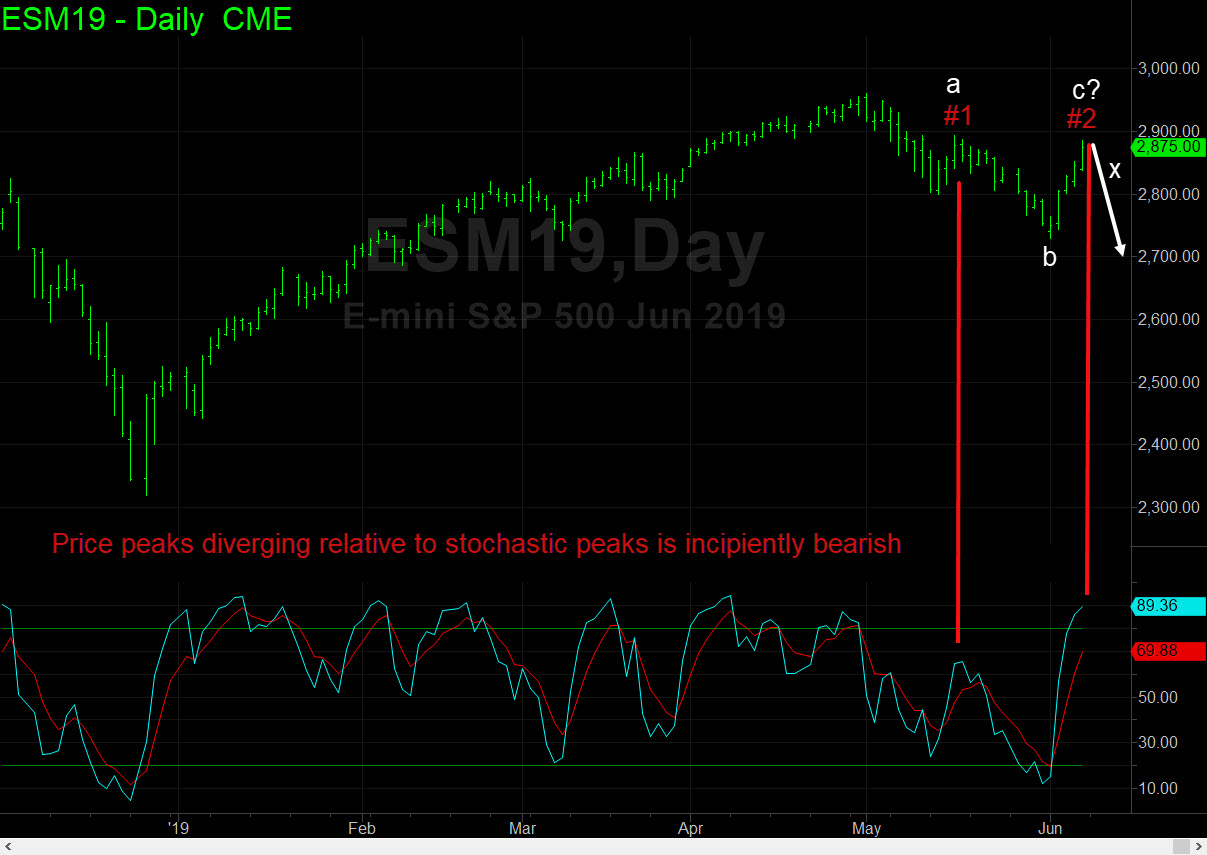
 Today’s chart is different from any I have presented here before because it emphasizes stochastic indicators rather than Hidden Pivots. The graph shows a potentially bearish divergence of price peaks relative to ‘overbought’ stochastic peaks. I say prospectively because the divergence would be negated if the futures were to rally above peak #1. In any event, the picture suggests that a very enticing ‘counterintuitive’ short could develop if ES were to turn down from a high close to, or even slightly above, peak #1. If the downturn trips a conventional sell signal at X, go short there with the goal of taking a partial profit at p (which remains to be determined). The potential for any downtrend from near these levels to achieve ‘d’ is significant, since the stochastic divergence would act as a kind of turbocharger. _______ UPDATE (June 10, 9:26 a.m. ET): The ‘CI’ short noted above would trigger on a drop touching 2856.50. This is based on C=2898.00, the overnight high. This is somewhat above A=2894.00, but that would not diminish the turbocharger effect or the attractiveness of the trade. A resurgence above 2898.00, however, would. Here’s the chart, which notes that a quick fall to the green line would give the trade a better chance of working.
ESM19 – June E-Mini S&P (Last:2889.25)