
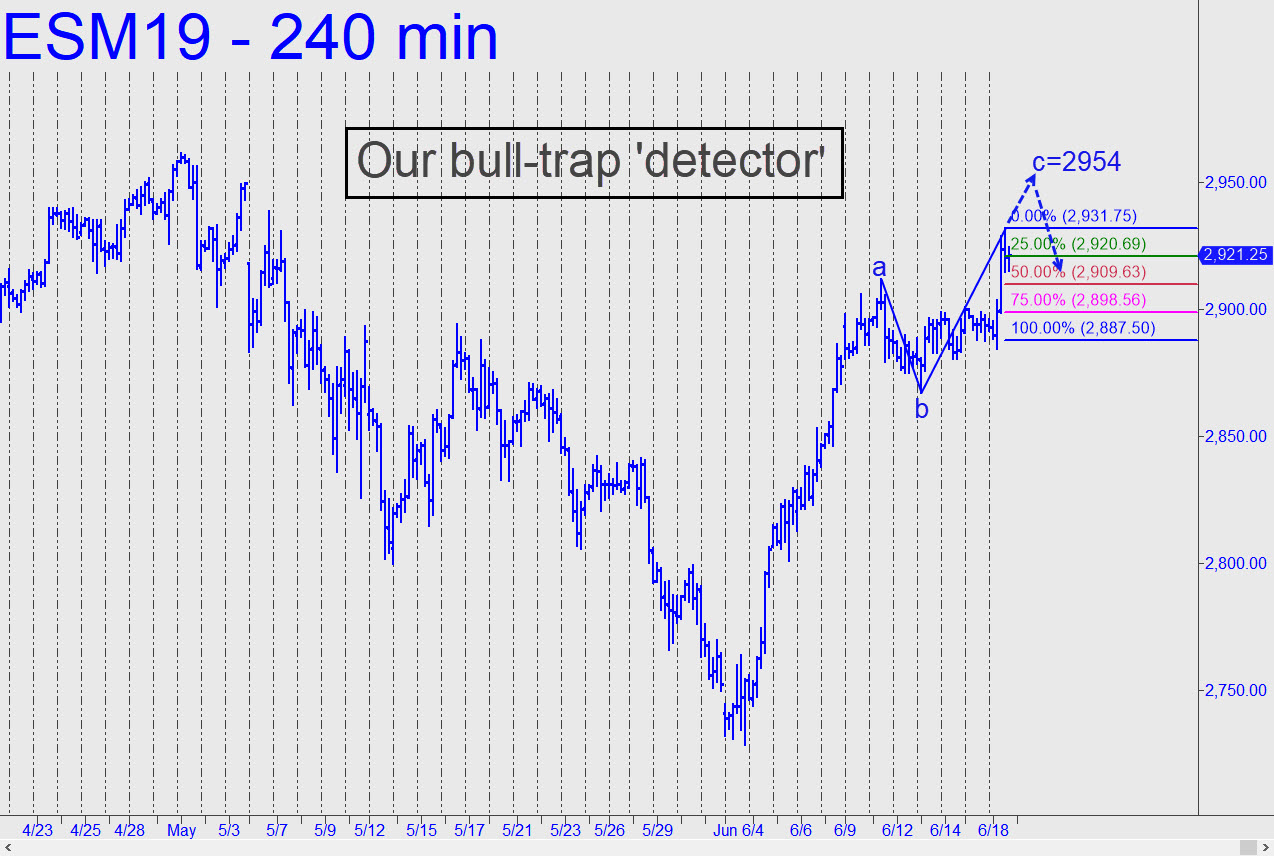
 The pattern shown in today’s chart (inset) may be helpful in determining whether June’s steep rally will prove to be a bull trap. Strictly speaking, it shows an rABC (reverse-ABC) set-up of the kind that we typically use when stalking ‘counterintuitive’ entries that go against the trend. In this case such a signal would be bearish, with a tripwire at the green line to tell us when to get short. However, the point ‘C’ high is not quite high enough to qualify as ideal. Better suited to our purpose would be a ‘C’ occurring nearer late May’s 2961 peak. A run-up to around 2954 would be ideal, and so that’s what we’ll look for.
These patterns are experimental and I have only recently begun to use them, not only in my own trades, but in set-ups we look for during Wednesday tutorial sessions. Since most subscribers will be unfamiliar with this adaptation of the Hidden Pivot Method, I will provide more-specific guidance than usual in the Trading Room if the set-up looks like it will pan out.
Notice as well that, taken as a whole, the chart shows an inverted, potentially very bullish inverted head-and-shoulders pattern. If you see it, you can also see that a plunge of 50-60 points from current levels would not diminish the bullish look of the chart. I don’t put much store in H&S patterns, but neither do I ignore them when they are this compelling. ______ UPDATE (Jun 20, 11:13 p.m.): Although a drop to 2905.50 (basis the September contract) would trigger a theoretical ‘counterintuitive’ short, I’d ignore the signal because there is a more compelling bullish target at 3095 still outstanding in the S&P 500 cash index.