
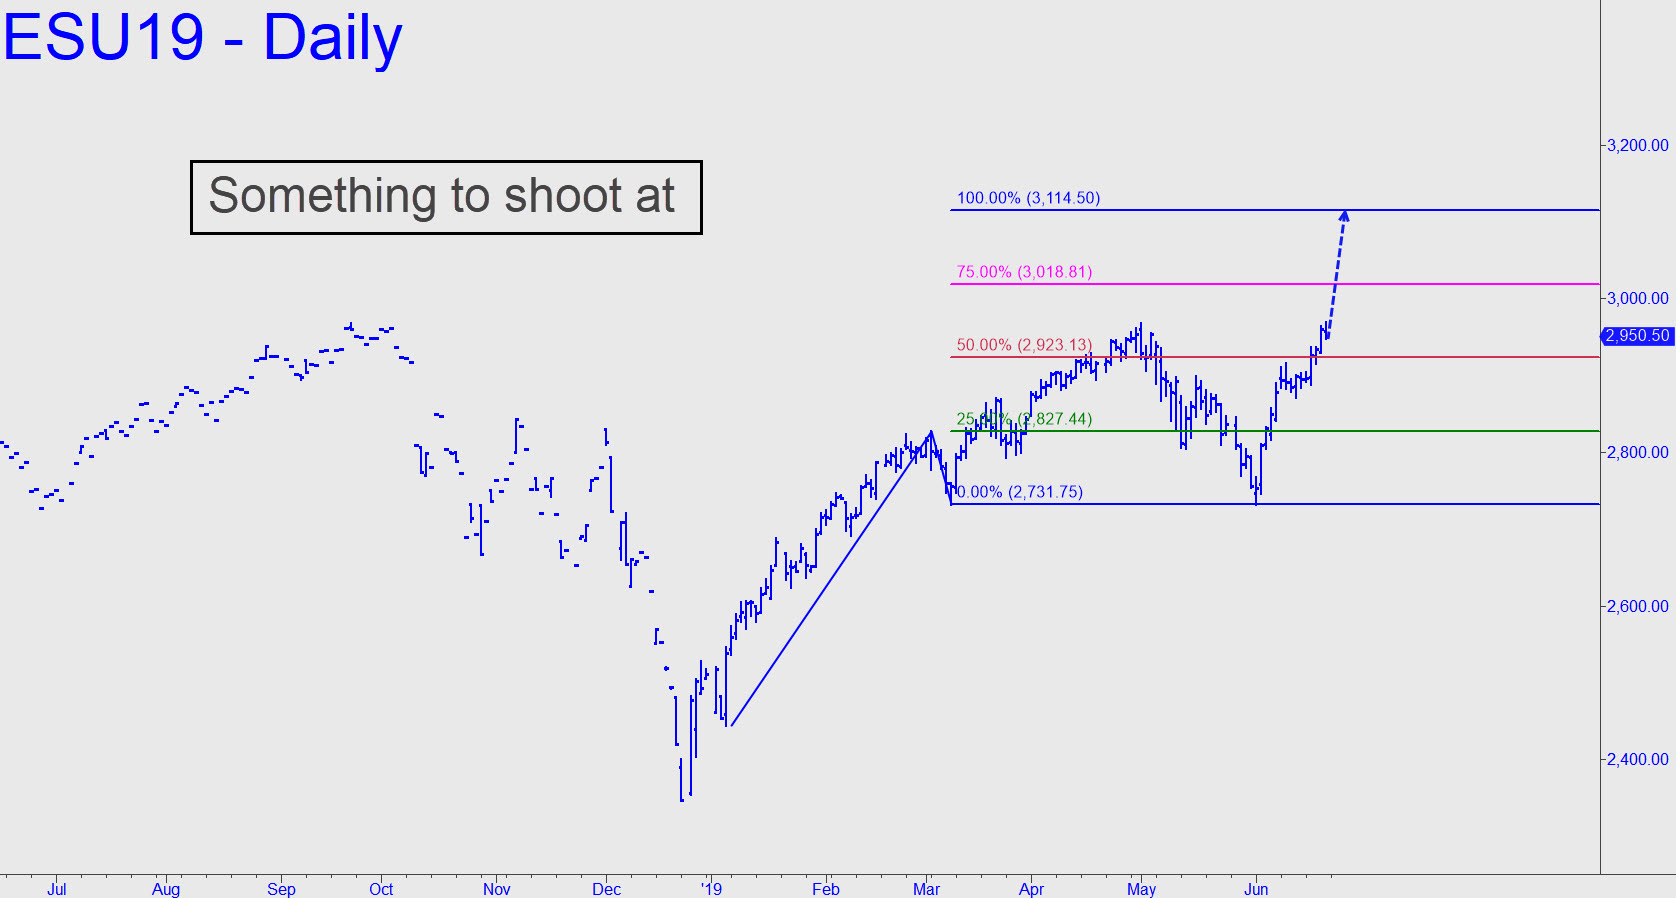
 The 3114.50 bull-market target shown is equivalent to one at 3095 for the S&P 500 Index introduced here a while back. The pattern is unusual because it came within less than a point of stopping out a textbook ‘mechanical’ buy that would have triggered on May 13 at the green line. Ordinarily I would take this as a sign of weakness. However, the subsequent ‘counterintuitive’ buy signal that triggered on the run-up back to the green line turned into one of the most powerful rallies in history. It now looks like no worse than a 50-50 bet to reach the 3114.50 target, but we should monitor buyers’ vital signs each step of the way in any event, since this would be a great place for Mr Market to spring a nasty bull trap. It would begin with a plunge to 2910.38, tripping a ‘counterintuitive’ short. That wouldn’t necessarily mean the end of the world, but it would give us good reason to be especially cautious. If it were to occur by Wednesday, that would make the weakness even more menacing. _______ UPDATE (Jun 25, 8:18 p.m. EDT): The September contract is closing fast on the 2910.38 trigger for a ‘CI’ short. This is a big-picture trade, and it carries $12,000 of initial risk on four contracts. I am not recommending it for that reason, but we can still use it to get a good ‘read’ on the downtrend. Specifically, if it triggers, that would imply the weakness is more menacing than most traders are likely to imagine at the time.
ESU19 – Sep E-Mini S&P (Last:2924.25)