
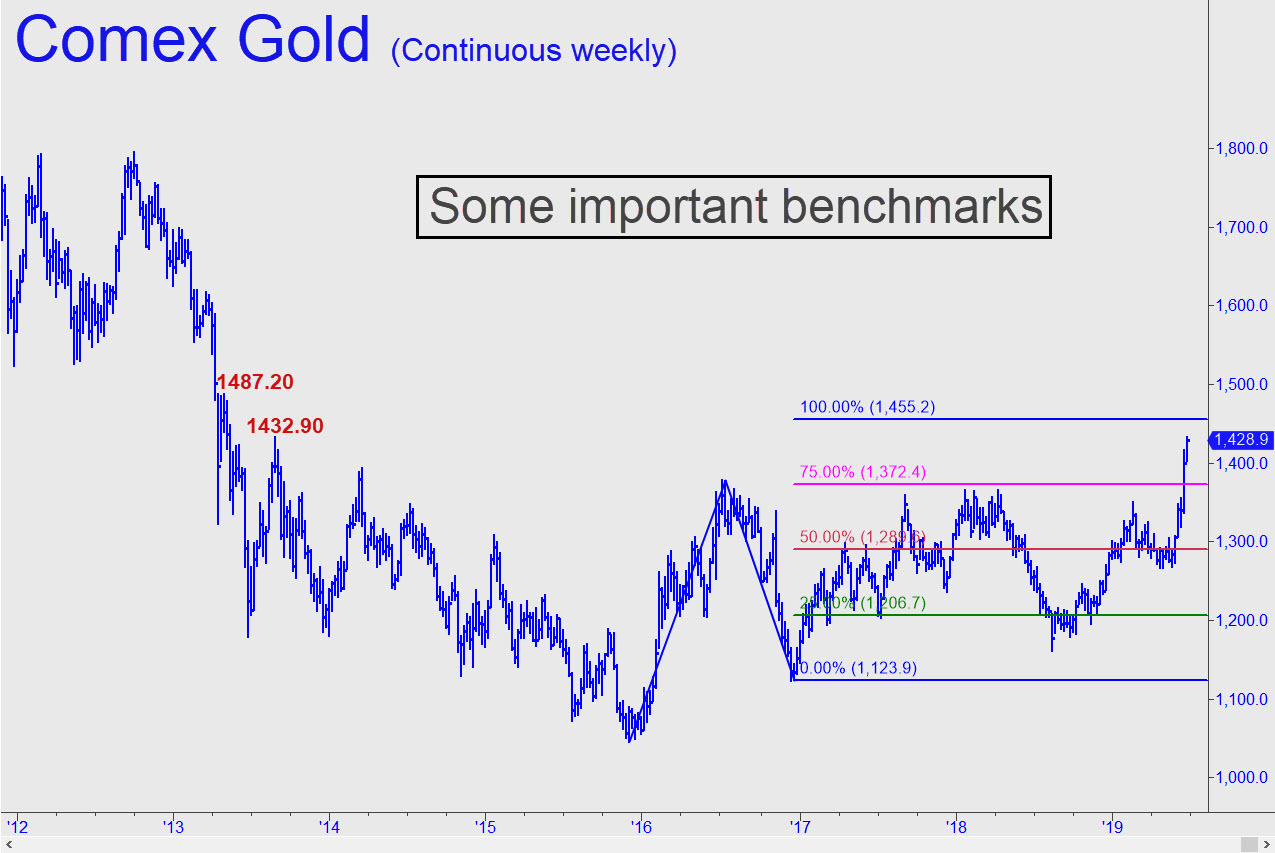
 Although the rally is growing more convincing by the day, the chart shows some key benchmarks that will need to be exceeded to buttress the case for a sustained move higher. Specifically, there is a Hidden Pivot resistance at 1455.20 that we should expect to show some stopping power. There are also ‘external’ peaks from 2013 at, respectively, 1432.40 and 1487.90 that must be surpassed in order to refresh the bullish impulsiveness of the weekly chart. (The lower was missed by less than a dollar today.) Because the chart is a composite of many expired contracts, the Hidden Pivot levels and peaks are not exact. But they should be close enough to actual — i.e., within $3-$5 — to be useful for gauging the strength of the rally and identifying its obstacles. ______ UPDATE (Jun 25, 8:12 p.m.): One obstacle overcome (1432.20), two more to go. But by exceeding the first, buyers generated a fresh impulse leg on the daily chart that will make any retracement holding above 1273.20 corrective and therefore potentially buy-able.
GCQ19 – August Gold (Last:1423.50)