
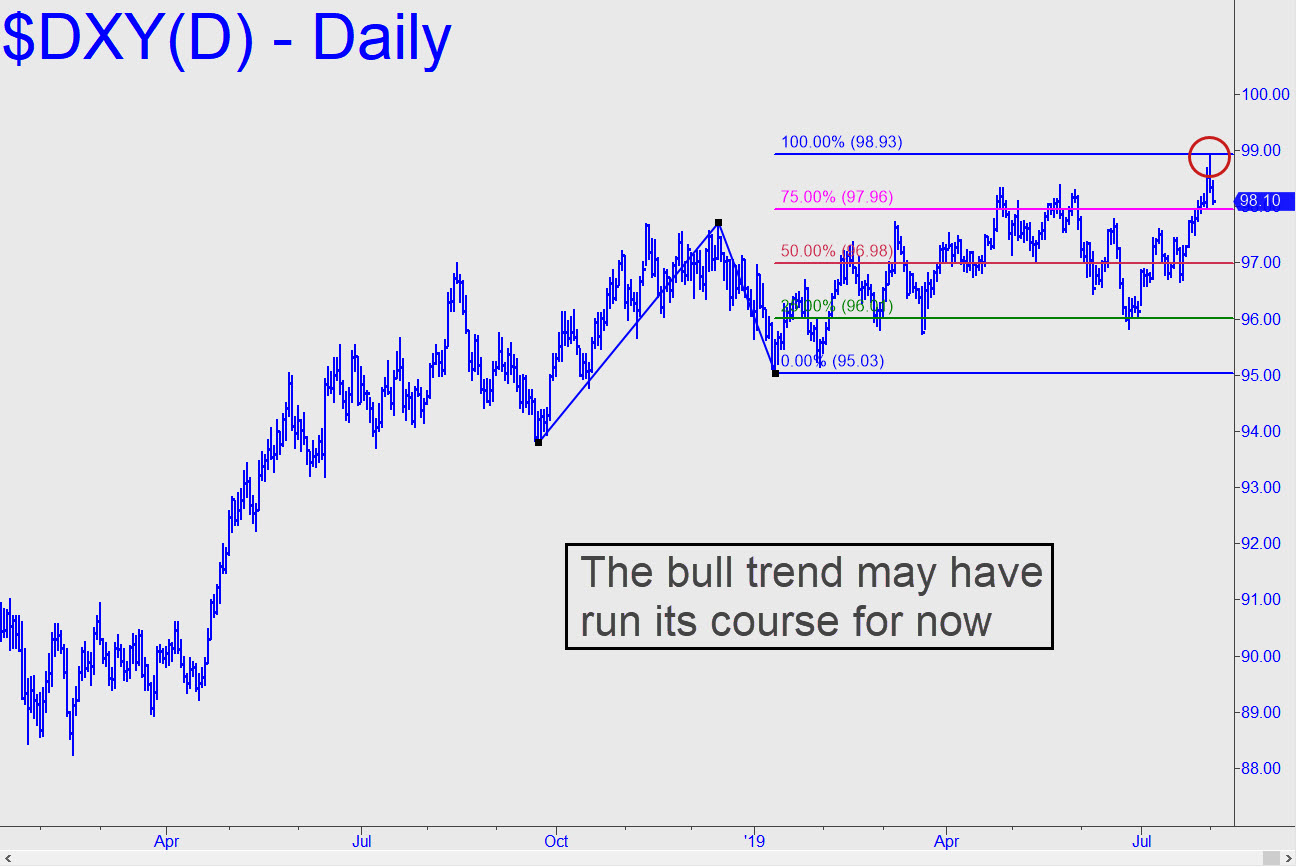
 We’d been focused on a Hidden Pivot at 99.05 as a target for this phase of the dollar’s long-term bull market, but when DXY sold off sharply without having reached it, I took a closer look at the daily chart. The slightly altered pattern yields a new target at 98.93 that turns out to have caught the exact top of last week’s rally. The pullback so far has been moderate and has not diminished my bullish bias for the long-term. But given the decisive precision of the recent top, it would appear that bulls are spent for the time being. _______ UPDATE (Sep 23, 6:15 p.m.): Here’s a chart with a new target at 99.94 that is starting to look better than the one given above. Use it with confidence, but don’t expect the dollar to get there any time soon. A pullback to 97.76 would trigger a ‘mechanical’ buy signal. _____ UPDATE (Oct 20, 2:33 p.m.): The dollar’s steep slide this month has caused whack-a-mole bears to surface in droves, but here’s a chart to remind us that the dollar is still in a bull market and that it will become a buy at some point. At the moment, the rABC pattern shown implies the signal to do so would trigger at 97.49 provided the C low at 97.14 has not been breached.
DXY – NYBOT Dollar Index (Last:97.26)