
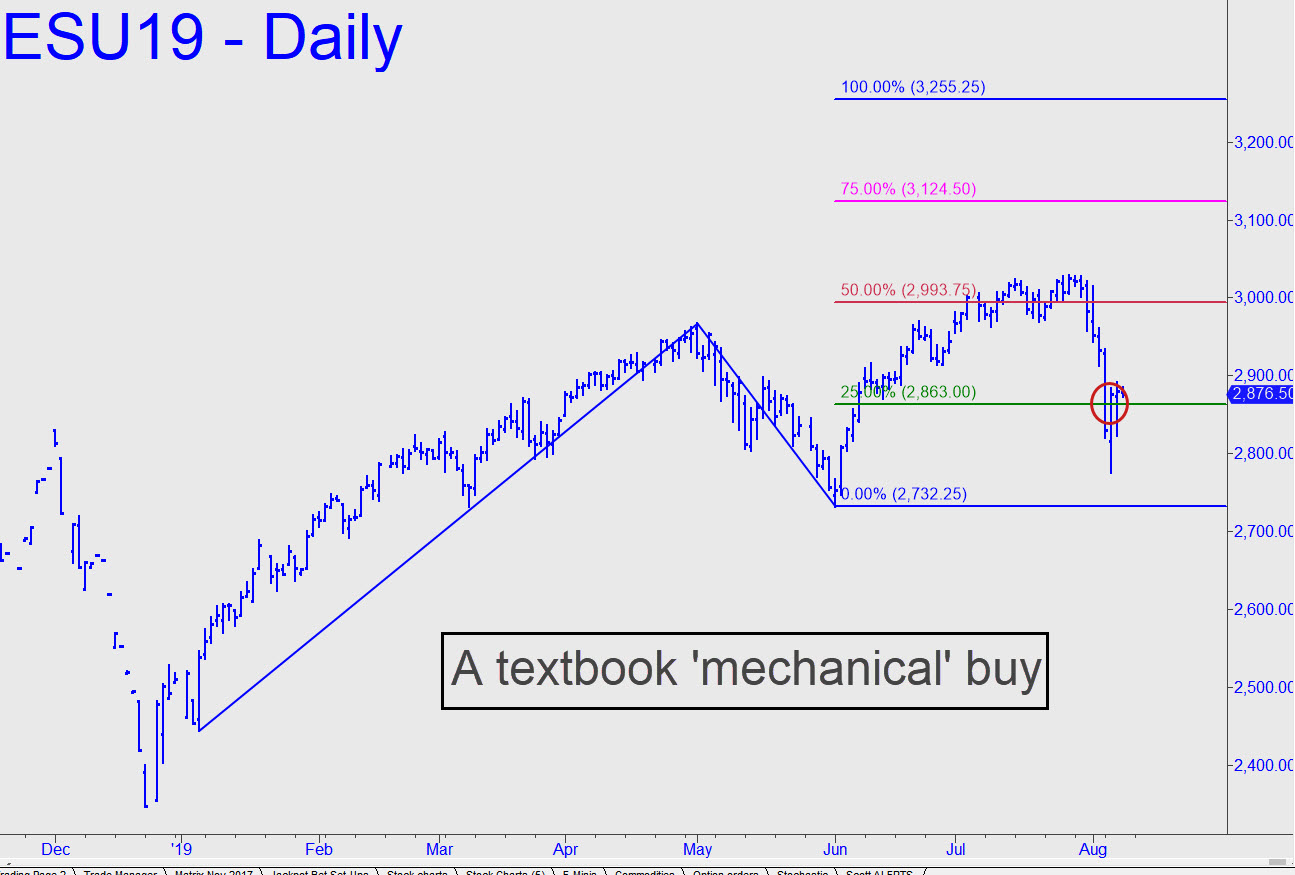
 My world view is much too gloomy at the moment for me to become a wild-eyed bull, what with the tariff war, mounting recessions in China and Europe, a top in the U.S. housing market, a possible top in consumer spending, and market leadership vested in fewer than a half-dozen stocks. Even so, the ‘mechanical’ set-up shown in today’s chart virtually screams to be bought. I mentioned the pattern earlier, somewhat incredulously, in connection with the Dow Industrials, but confronting it on the chart of a vehicle we actually trade is a little unsettling. There was $26,000 of initial risk in this gambit if four contracts were used, and we would not exactly be sighing with relief with a gain so far of just $2600 per contract. Regardless, we should contemplate this chart with a bullish bias and trade it accordingly, albeit as cautiously as possible. The midpoint pivot at 2993.75 is my minimum upside objective for the moment, but I expect it to be a very bumpy ride. If any of you actually did the trade and there are at least two of you, I’d be happy to set up a tracking position. _______ UPDATE (Aug 8, 10:44 p.m.): Short-covering pushed this hoax to the minor target at 2936.75 shown here. The pullback so far has been shallow, suggesting that buyers will be back at ’em when the exchanges open for regular business Friday morning.
ESU19 – Sep E-Mini S&P (Last:2928.25)