
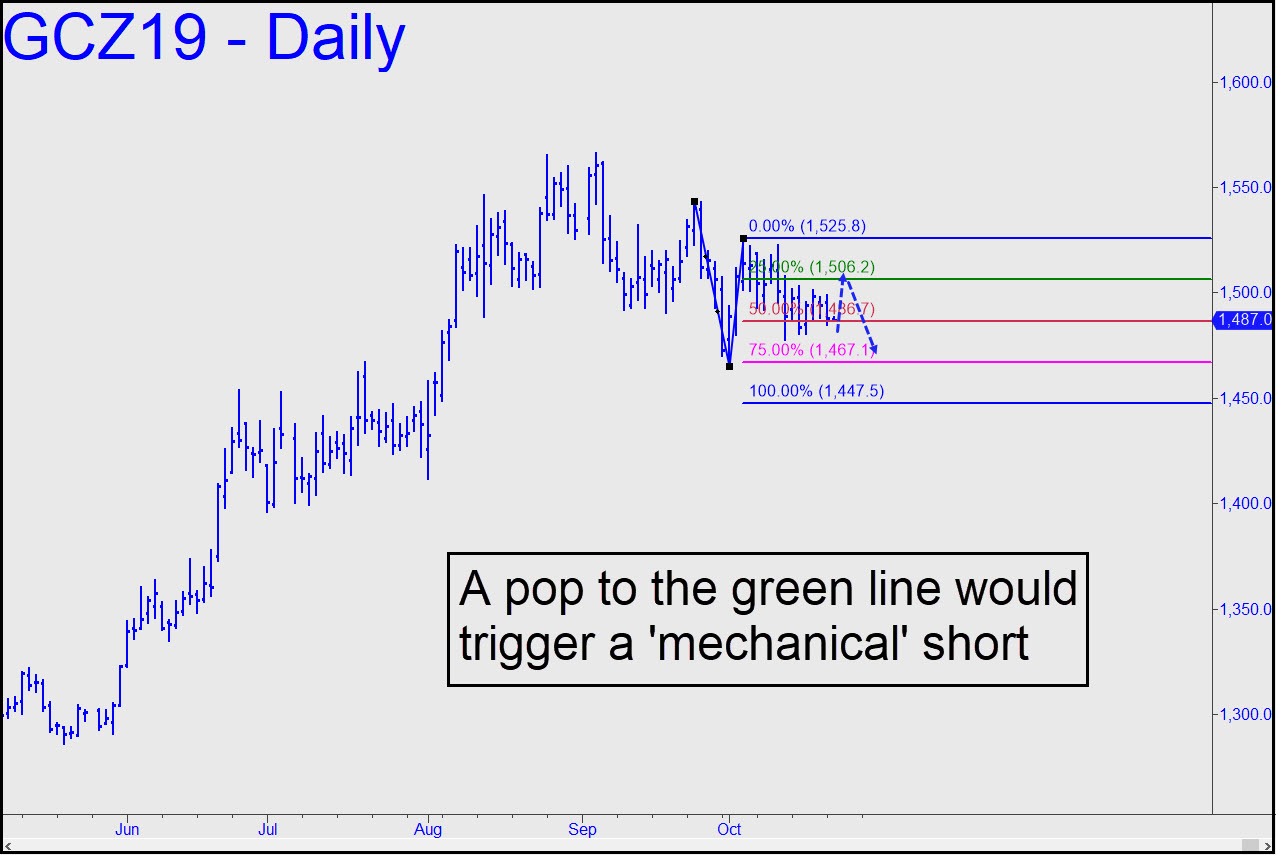
 This chart revises our downside targets somewhat to, respectively, a minimum p2=1467.10; or D=1447.50 if any lower. The A-B impulse leg is a clean one that allows a little more room to the downside than the smaller pattern given earlier. It is setting up for a ‘mechanical’ short at 1506.20, but because initial risk on a 1526.00 stop-loss would be nearly $2000 per contract, we’ll look for an alternative entry trigger on a lesser chart. An rABC set-up using the hourly might work, but we can play it by ear until such time as 1506.20 is achieved. ______ UPDATE (Oct 22, 10:19 p.m. EDT): The longer gold moves sideways, the less attractive the short trade would become. At this point, I’ll treat any rally exceeding 1508.00 as a bullish opportunity, with immediate upside potential to 1535.90 (60-min, A=1467.90 on 10/1). _______ UPDATE (Oct 24, 6:15): The 1507.00 midpoint resistance of this pattern looked shortable when it was first hit this afternoon, and at least one Trading Room denizen did so on my suggestion. However, even though the pullback would have produced a profit of $240 per contract at the subsequent low, the shallowness of the correction suggests buyers are revved up for another bull leg. Assuming they blow past p on Friday, that would imply the futures are bound for at least D=1513.80. ______ UPDATE (Oct 25, 8:51): The overnight thrust through 1507.00 all but guarantees a run-up to at last 1535.90 off this pattern, which has appeared here before (see above). It has been reactivated and energized — perhaps sufficiently to use a ‘mechanical’ bid at 1507.00 to get long belatedly. The stop-loss would be at 1497.30.
GCZ19 – December Gold (Last:1506.20)