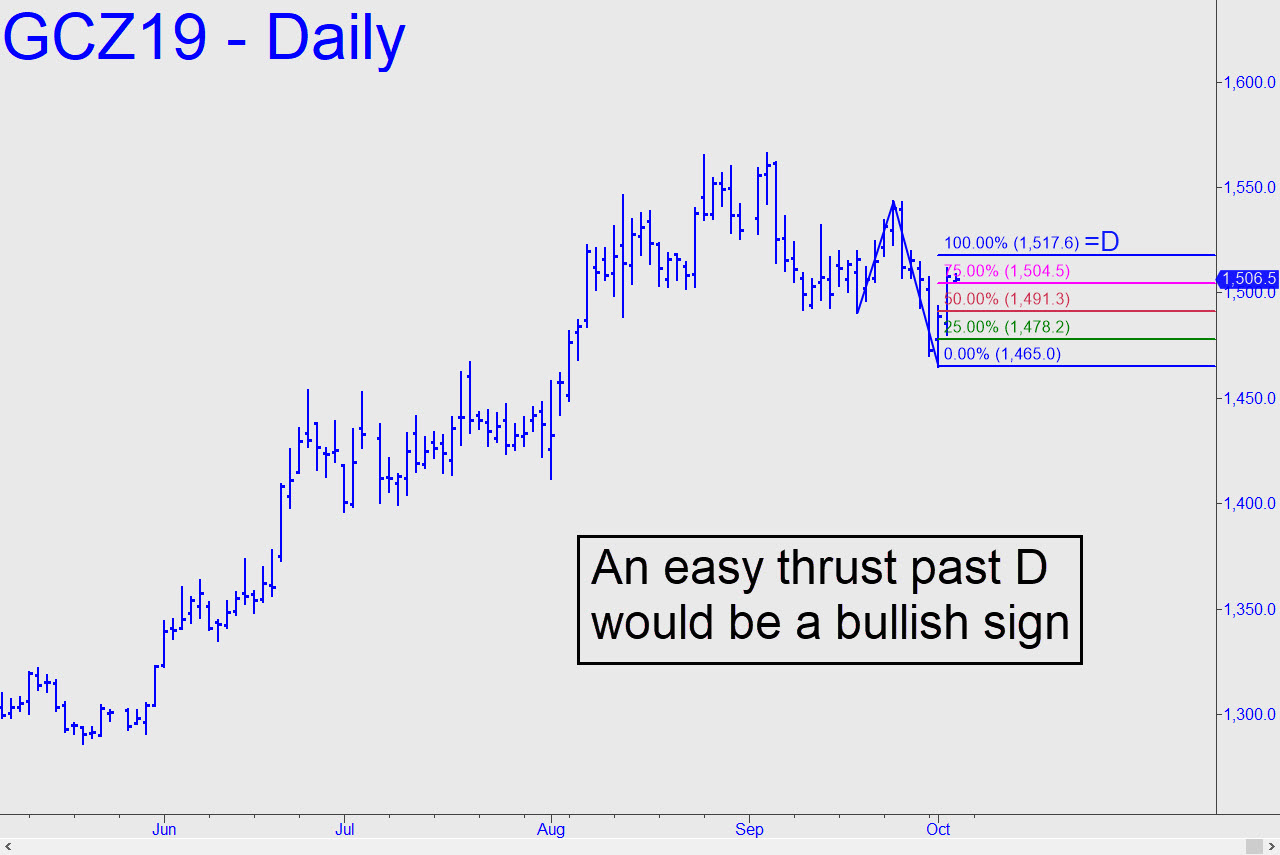
 The chart shown simplifies the short-term picture as much as possible. Although we do not usually rely on ‘reverse’ ABC patterns like this one to trade against, they are proving their worth when used analytically. In this instance there is a clear ‘D’ target at 1517.80 that we should expect to show some stopping power. If it proves to be a pushover, and particularly if the futures close above it for two consecutive days, that would set up an almost certain test of late September’s peak near 1543. Alternatively, a pullback to the red line (p=1491.30) can be used to get long ‘mechanically’, stop 1482.50. Please note that initial theoretical risk would be $880 per contract, so the trade is not recommended for beginners or small accounts. ______ UPDATE (Oct 3, 8:31 p.m. ET): Buyers shredded the 1517.80 pivot, implying more upside to come. Now, if the futures touch 1515.90 without dipping below 1510.60 first, that would put a 1532.40 target in play. The midpoint resistance lies at 1521.50 (30-min, A=1504.00 on 10/3 at 9:30 a.m.). _______ UPDATE (Oct 4, 9:26 a.m.): News-related histrionics have negated the trade. The futures have since tripped two minor rABC ‘buy’ signals that have produced profits at their respective midpoint pivots but which were out of reach for trader not spring-loaded and glued to the 5-minute chart.
