
 Should we be concerned that stock-market bulls have been on a take-no-prisoners rampage, acting as though all is right with the world? It was only a few months ago, after all, that investors were said to be deeply troubled over the prospect of global recession and dimming odds of a meaningful trade deal with China. Not that these problems, which haven’t abated other than in investors’ forgetful brains, much slowed the onslaught of buying. Stocks rose over the summer anyway, even as yields were falling to levels implying the U.S. would soon join Europe and China in recession. Now, with interest rates again on the rise, the Dow Industrials and S&Ps have illogically been hitting record highs, prompting this headline in the Wall Street Journal: “Rising Yields Quiet Bond Market’s Key Recession Alarm“. But don’t break out the bubbly quite yet. For as our friend Bob Hoye points out in his latest Pivotal Events, the fact that the yield curve is no longer inverted hardly means that the warning has gone away. “Not likely,” he notes, “as the trend to inversion and the actual inversion is a key form of speculation in the credit markets. Once done it can’t be erased and the contraction is inevitable.”
Bob is renowned as a diligent student of market history, and you can be certain he has not misused the word “inevitable” merely to seize our attention. He tracks data stretching back hundreds of years, and his spot-on predictions have always ranked him near the very top of economic forecasters. His chartist, Ross Clark, whom I’ve called the Ray Charles/Mozart of technical analysis, is no slouch either. Both are cautious right now, with Ross noting successful tests of support by the Dow Industrials in May, August and September. However, he would regard a failure to break out above 28,300 as bearish if followed by a breach of the 50-day exponential moving average and October 24’s 26,714 low.
A Blowoff?
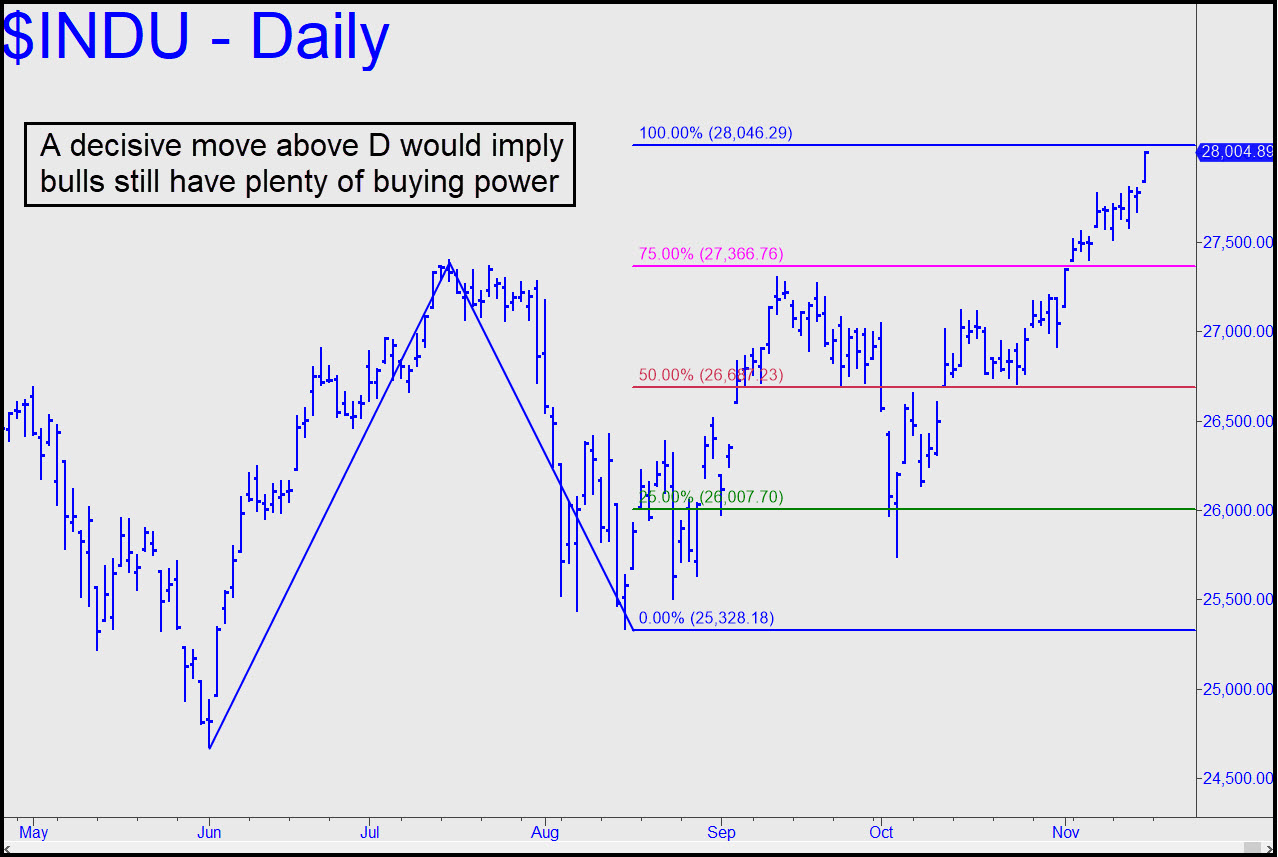
Whatever happens, we are challenged to explain why shares continue to surge on most days almost as predictably as that the sun will rise in the east . The suspicion grows that the stock market is in the wacky, damn-the-torpedoes blowoff phase of the the bull-market begun in March 2009. Blowoffs cannot continue indefinitely, though. Their pitch is unsustainable, as the word itself implies, and stocks eventually must crest when buying power runs out. No equation can tell us when this will occur, since the sources of investable cash that support the buying are innumerable and too arcane to comprehend, let alone measure accurately. And so we rely on stock charts to tell us where key highs and lows are most likely to occur. Right now, the charts are saying the S&P 500 and the New York Composite Index are within respective hairs of major trendlines stretching back for years. However, the Dow Industrial Average and the Nasdaq 100 have already decisively exceeded their respective trendlines, and this is undeniably bullish. But there’s a caveat: Both are within easy distance of rally-stopping targets derived from the Hidden Pivot method of analysis. At the risk of queering the predictive power of the targets by drum-rolling them, I’ll note that the Dow target lies at 28,046, just 42 points above Friday’s record high; and the Nasdaq’s at 8,365 — 12 points above its corresponding high. If these numbers are decisively exceeded intraday or surpassed on a closing basis for two consecutive days, we’d have to infer that the buying stampede of 2019 is likely to continue.
But why? Here we’ll quote one of the better explanations we’ve seen for the stock market’s relentless uptrend. In a Wall Street Journal think-piece headlined All News Is Good News When the Market Keeps Ripping Higher, columnist James Mackintosh notes the following: “My best case is that the economy muddles through, trade tensions dissipate and earnings turn out to be sustainable, despite leverage and accounting tricks.” This probably sums up institutional mindset perfectly. But even Mackintosh concedes it “pretty optimistic,” since it leaves no room for trouble. We’ll suggest going with the flow for now, meaning that any pullback from significantly above the targets for S&Ps and Nasdaq 100 be viewed as merely corrective. Even so, we intend to monitor the intraday charts closely, since that’s where trouble will show up even before pundits and economists have a clue.