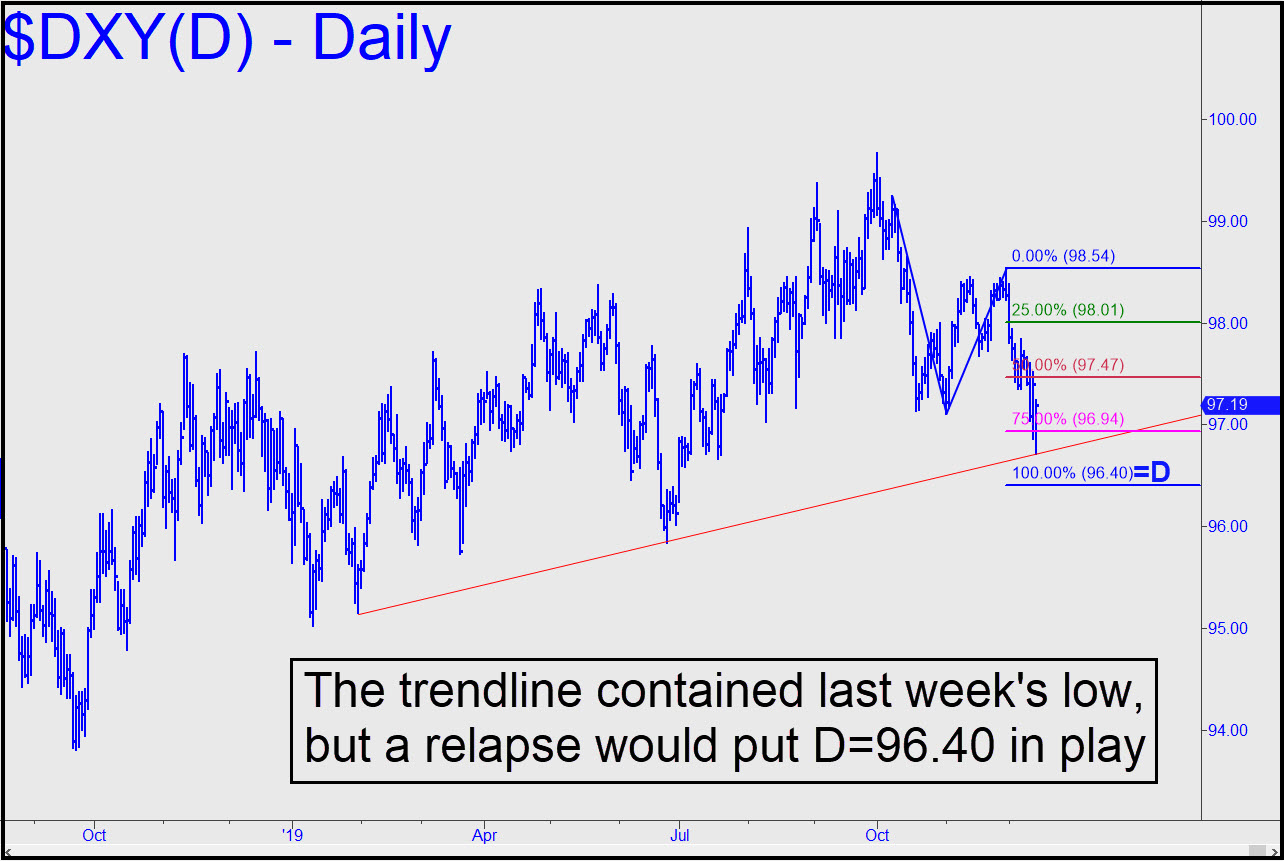
 I’ve been steadfastly bullish on the dollar for years, in part because a strong dollar is congruent with the deflationary endgame that seems likely when the stock-market bubble bursts. Even so, it’s conceivable we could see an inflationary blip along the way, especially under a president who seems determined to weaken the dollar to help U.S. manufacturers. The intermediate-term chart (inset) therefore bears watching, since it could provide us with evidence that the dollar weakness since early October is about to intensify. Despite Friday’s robust bounce from the trendline, I expect a relapse to reach the target. If it breaches it, and especially if the downtrend goes on to exceed June’s low at at 95.84, that would be the first yellow flag we’ve seen in the greenback since August 2017.______ UPDATE (Jan 1, 3:50 p.m. EST): Yesterday’s low slightly exceeded the 96.40 target shown in the chart. (I somehow failed to mention this target in the tout when I published it two weeks ago.) The bounce so far has been fleeting and feeble, hinting of still lower prices to come. ______ UPDATE (Jan 7, 10:38 p.m.): Heightened tensions with Iran have given the dollar good reason to rally, and yet it is barely getting any loft from the 96.40 Hidden Pivot noted above. This is plainly bearish and will remain so unless the crisis escalates significantly. _______ UPDATE (Jan 13, 5:55 p.m.): DXY’s rally has lengthened modestly since the 96.40 bottom was in, but bulls will need to surpass 97.94, where a small ‘external’ peak was recorded Dec 2 on the hourly chart, for the uptrend to gain credibility. _______ UPDATE (Jan 24, 9:34 a.m.): DXY is just an inch shy of the 97.95 print required to re-energize and extend the bull run from the predicted low at 96.40 low recorded a month ago. This would keep the pressure on gold, which has been holding its own regardless.
DXY – NYBOT Dollar Index (Last:97.80)
 Posted on December 15, 2019, 5:05 pm EST
Last Updated January 24, 2020, 9:34 am EST
