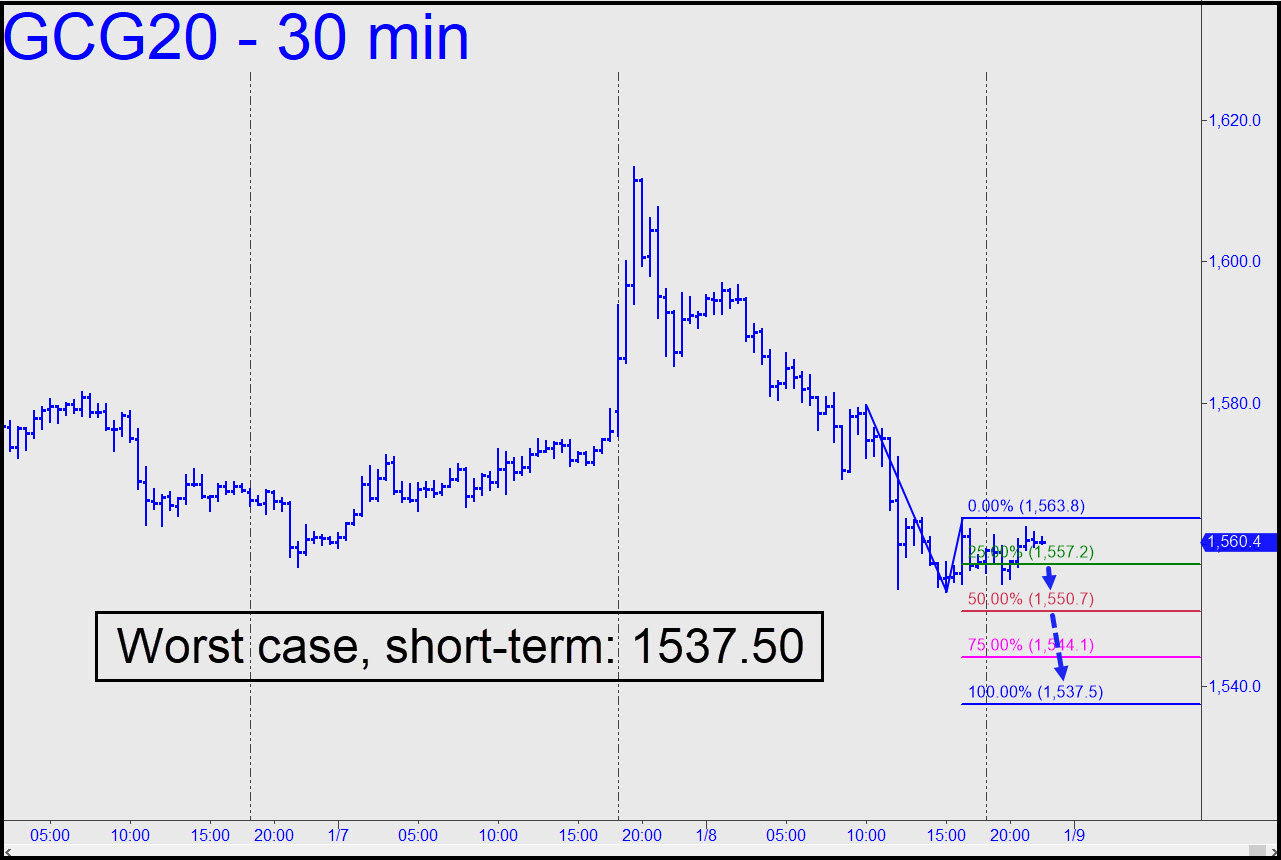
Friday’s steep slide created a robustly bullish impulse leg on the intraday charts that points to as low as 1537.50 over the near term. The futures will have a chance to bounce from 1550.70, a midpoint pivot that you can use to bottom-fish or buy with an rABC set-up. Any lower, especially if the pivot is decisively exceeded, would open a path to the lower target. It’s also possible buyers will turn things around without the February contract having reached p. However, that would have no bullish implications until such time as the rally exceeds the 1579.70 ‘external’ peak I’ve used as the pattern’s point ‘A’. _____ UPDATE (Jan 9, 11:18 a.m. EST): Panicky sellers drove gold $14 lower in under 30 minutes early Thursday morning, touching a low at 1541.00 that missed my target by $3.50. A subsequent rally to the green line tripped a ‘mechanical’ short predicated on a 1537.50 target that is still viable. It would take a print at 1562.50 for bulls to turn things around. _______ UPDATE (Jan 9, 11:35 a.m.): Urgent! Here is yet a further update for gold — a chart that you can use as a road map for the next 2-3 days. _______ UPDATE (Jan 9, 9:12 p.m.): The short-term outlook has dimmed further with the slow descent toward key support at p=1542.20 (click on the link immediately above to see this). A close beneath it would shorten the odds of further slippage to at least p2=1531.30, or possibly even the 1520.50 target shown in the chart linked in today’s earlier update.
GCG20 – February Gold (Last:1548.80)