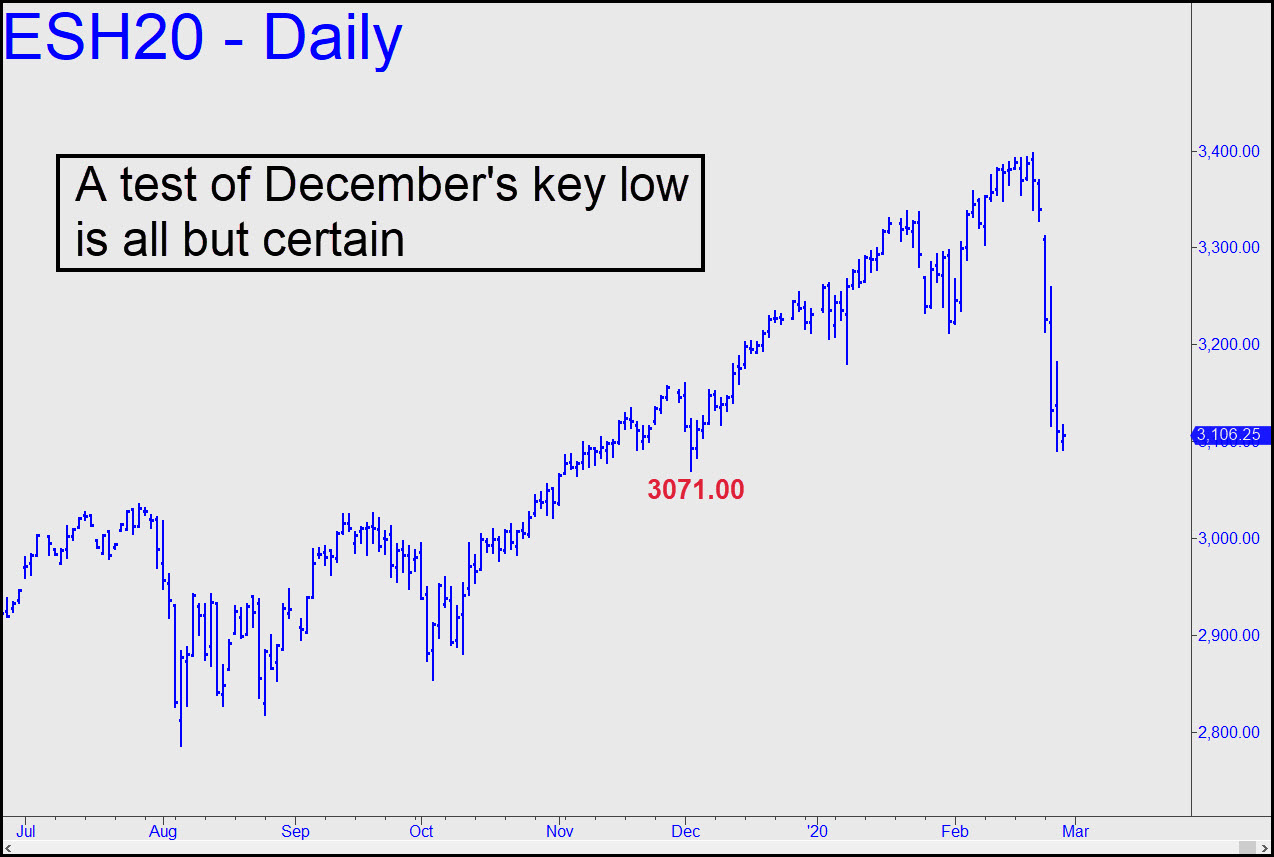
 Today’s inverted swoon portends more downside to at least 3071.00, where an important low was recorded in early December. Too many bulls are counting on it for support, and that’s why it will be exceeded at least marginally. At that point the bearish pattern shown in this chart would become not just dominant but predictable, meaning we should expect a bounce, possibly tradeable, from p2=3053.84; and an even more likely one from D=3011.44 exactly. The pattern is a little gnarly because its point ‘A’ is not obvious, and that’s why I expect it to work for our usual purposes, particularly trading from either side of the market on the way down. _______ UPDATE (Feb 27, 8:22 a.m. EST): Tradestation’s sometimes twitchy tool set appears to have done me out of an overnight opportunity. Although I was very careful drawing the pattern that yielded downside targets at, respectively, 3053.84 and 3011.84 (see above), I apparently wasn’t careful enough. Here’s a corrected chart that shows a p2 at 3055.63 that came a crucial inch closer to nailing the overnight low: https://bit.ly/396fSth The ostensibly small difference was enough to put the rABC I would have used (a=3091.00 at 5:00 am yesterday) to set up the trade just out of reach. Anyway, the corrected levels are: p2=3055.63 and D=3013.50. Prepare to be front-run at the latter — yes, the algo chimpanzees seem to have learned one of my tricks — when (not if) ES falls to it.______ UPDATE (Feb 27, 8:31 p.m.): Judging from reports in the trading Room today, many subscribers kicked butt as stocks plunged, visiting disaster on most investors. I’ve linked charts in The Morning Line with possible bottoming numbers in AAPL, T-Bond Yields and the Dow. Here’s another for the E-Mini S&Ps, with a promising target at 2884.00.
