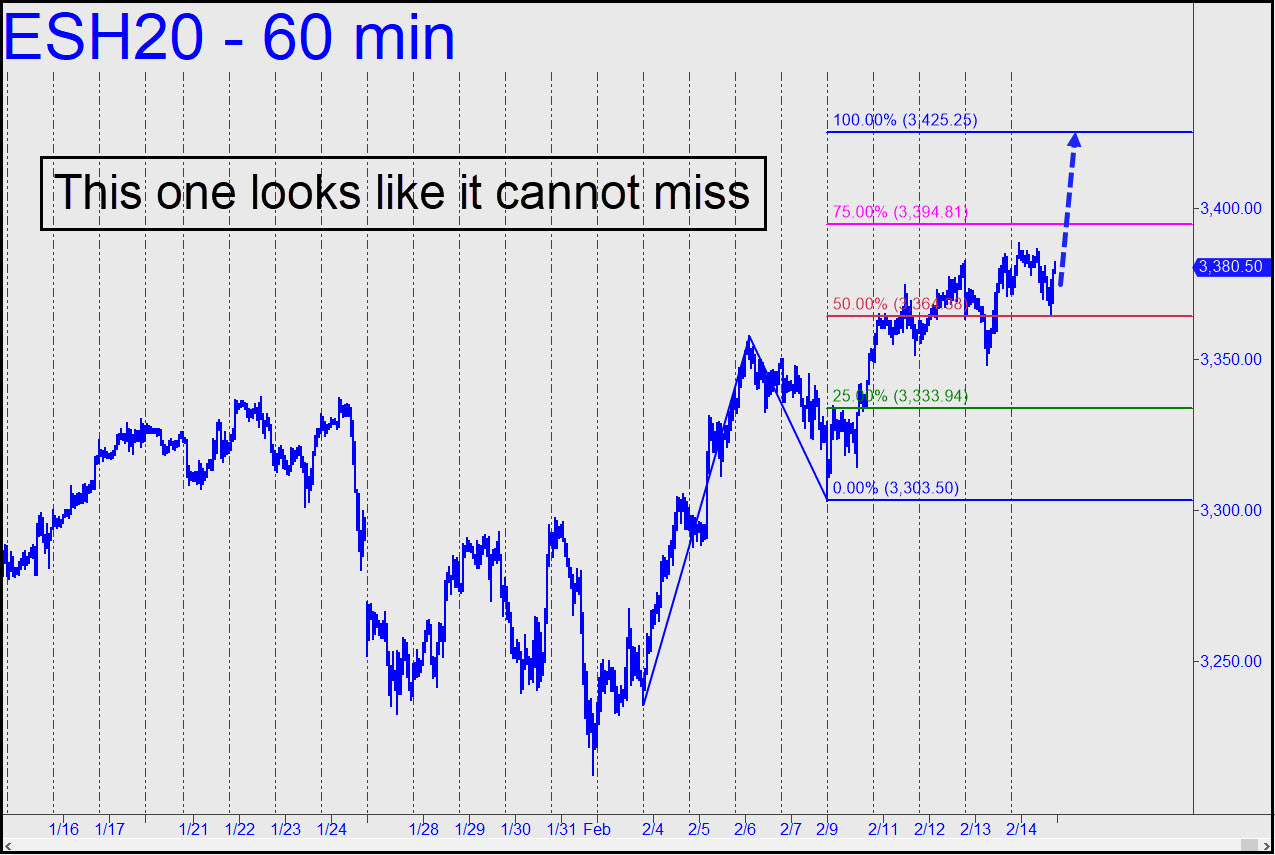
 The 3425.25 rally target shown in the chart looks potentially useful — not only as a minimum upside objective for trading from the long side, but as place to attempt shorting either with a tight stop-loss or an rABC pattern of lesser degree. Note that the futures took a strong bounce Friday from the red line, the pattern’s midpoint pivot. In retrospect, we can see that a bid there would have produced a quick gain of as much as $850 per contract. Is there a rule we can formulate that would make it easier to exploit such opportunities? Let me try, as follows: Attempt a ‘mechanical’ buy at the red line if an earlier pullback from our proprietary ‘sweet spot’ fails to come down to the green line where we typically initiate the trade. As always, the stop-loss on such trades is equal to a third of the differential between the entry price and the D target. I should also mention that the C-D follow-through leg, or at least what exists of it so far, did not exactly blow past p=3364.38. This implies that a move to D is not quite a done deal, even if the pattern looks strong enough to get the futures there. _______ UPDATE (Feb 19, 7:12 p.m. EST): The 3425.25 target billboarded above has served us well. Here’s a smaller pattern with a lesser target at 3415.00 that can be used on Thursday to improve your odds of engaging profitably with the futures, whether long or short.

Comments on this entry are closed.
nah .. like ricks style .. but alas forget it .. just another cog in the americano salami factory .. nah no hardened bears here just gamblers at the track at wall and broad . no hard feelings
&&&&&
Gamblers? No hardened bears? Len, your vantage point in Lurkerville is missing the best things about Rick’s Picks — the most accurate forecasts in the trading world, for one, and the objectivity to trade the bull market from the long side while hating it every inch of the way.
You should try the free two-week trial subscription offered on the home page to see what’s going on behind the paid-subscriber wall. RA