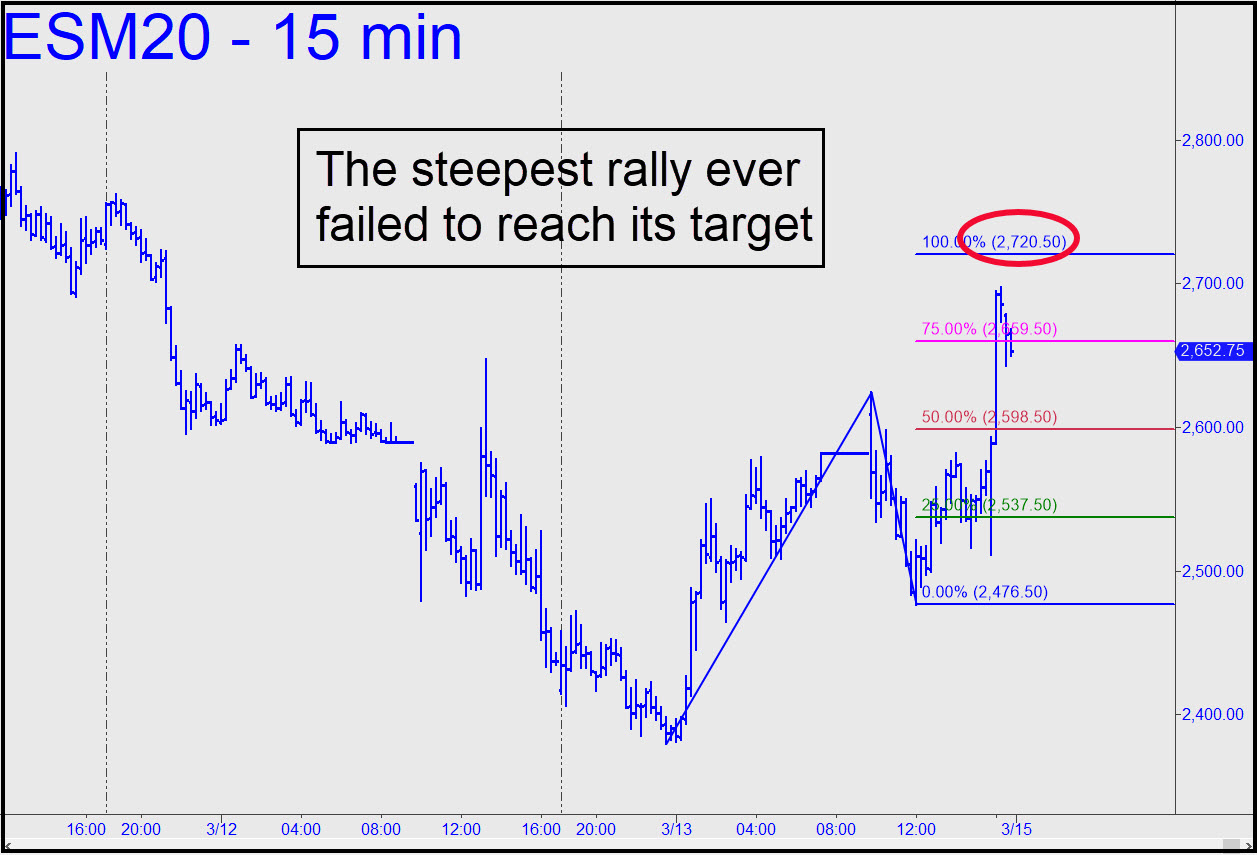
 Hey, don’t shoot me, I’m only the messenger, but the biggest one-day rally in history failed by a significant margin to reach its D target. That would be 2720.50, as the chart shows, but buyers sputtered out nearly 50 points shy of this Hidden Pivot resistance. It was worse than that, actually, since the A-B leg of the pattern shown wasn’t even impulsive, strictly speaking, since its point ‘B’ high failed to surpass any ‘external’ peaks. Can you smell fake? In any event, I’m not going to suggest getting in the way of the upthrust, fake or not. We’ll just have to wait and see what Sunday night/Monday morning brings before we place any bets. If you are following this vehicle’s charts yourself, don’t be intimidated by the size of the swings. The way they play out and their predictability is exactly the same as if they were insignificant moves on a one-minute chart. That’s how you should view them if you want to cut the moves down to tradeable size. ______ UPDATE (Mar 15, 11:35 p.m.): Regulatory circuit breakers have arrested the futures’ hellish plunge Sunday night, but I don’t see how the June contract, which settled Friday at 2684, can avoid plummeting all the way to 2204 (!) eventually, circuit breakers or not. That target would be an odds-on bet as far as I’m concerned if p=2450.75, the midpoint Hidden Pivot in this hourly chart gets schmeissed when stocks open Monday morning. This would equate to an approximately 4600-point fall in the Dow Industrials, to 18,500. _____ UPDATE (Mar 18, 9:04 p.m.): Although the 2204 downside target remains quite viable, we’ll need to respect today’s short squeeze off the lows, since it generated a bullish impulse leg on the hourly chart.
ESM20 – June E-Mini S&Ps (Last:2555.50)
 Posted on March 15, 2020, 5:12 pm EDT
Last Updated March 18, 2020, 9:01 pm EDT
