
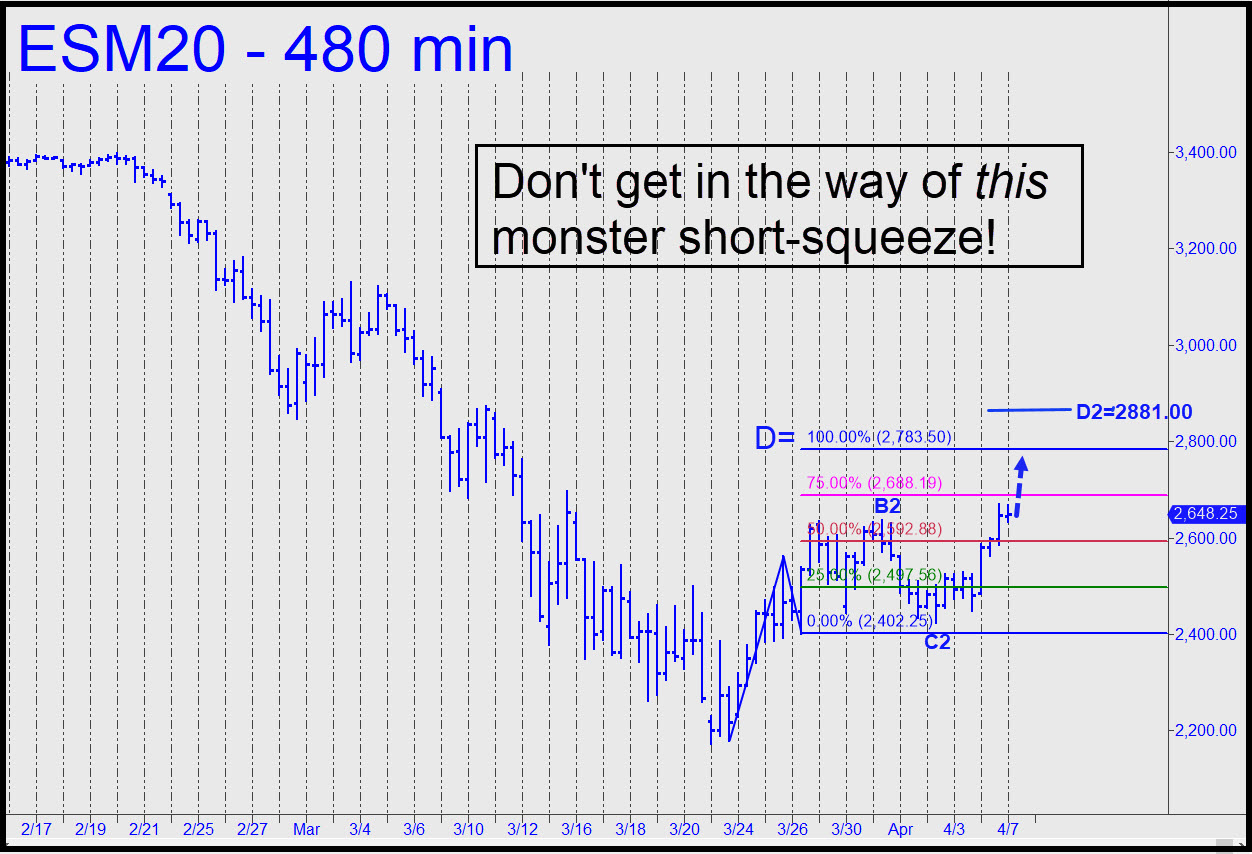
 Like every other trader who listened to the news over the weekend, I was very bearish when I came to my desk Monday morning, and that is exactly why the short-squeeze was so powerful. To determine where it was headed, I looked at charts in various time frames and came up with an implausibly bullish target at 2783.50 that is shown in the inset. I warned subscribers to get out of the way and did so myself, since the chart implied the upthrust still had another 187 points to go. By day’s end that had been reduced to 115 points, and I have little doubt 2783.50 will be reached. If it is decisively exceeded, please note that the rally could go all the way to 2881.00. That Hidden Pivot resistance is derived from the higher corrective coordinates that I’ve labeled B2/C2. We’ll trade with a bullish bias for now, but also look for shorting opportunities at the various HP levels. One more note: The secondary pivot (p2) of the bigger pattern lies at 2652.00, which has been penetrated only slightly so far and was giving buyers a little pushback Monday evening. _______ UPDATE (Apr 7, 9:29 p.m. EDT): The reversal from an early-morning high 33 points shy of the 2783 target warrants caution. Bulls got ahead of themselves, but it remains to be seen how badly Mr. Market will punish them for their brash enthusiasm as the day began. A pullback to the green line (2497) would trip a so-so ‘mechanical’ buy, but I’m not recommending taking action at the moment. _______ UPDATE (Apr 8, 9:25 p.m.): Up, up and away! I am holding to the 2783.50 target flagged above, or if the futures penetrate it decisively, to another at 2881.00. The lower number should be short-able, but I am recommending this only to subscribers who have caught a profitable piece of the rally to it.
ESM20 – June E-Mini S&Ps (Last:2741.25)