
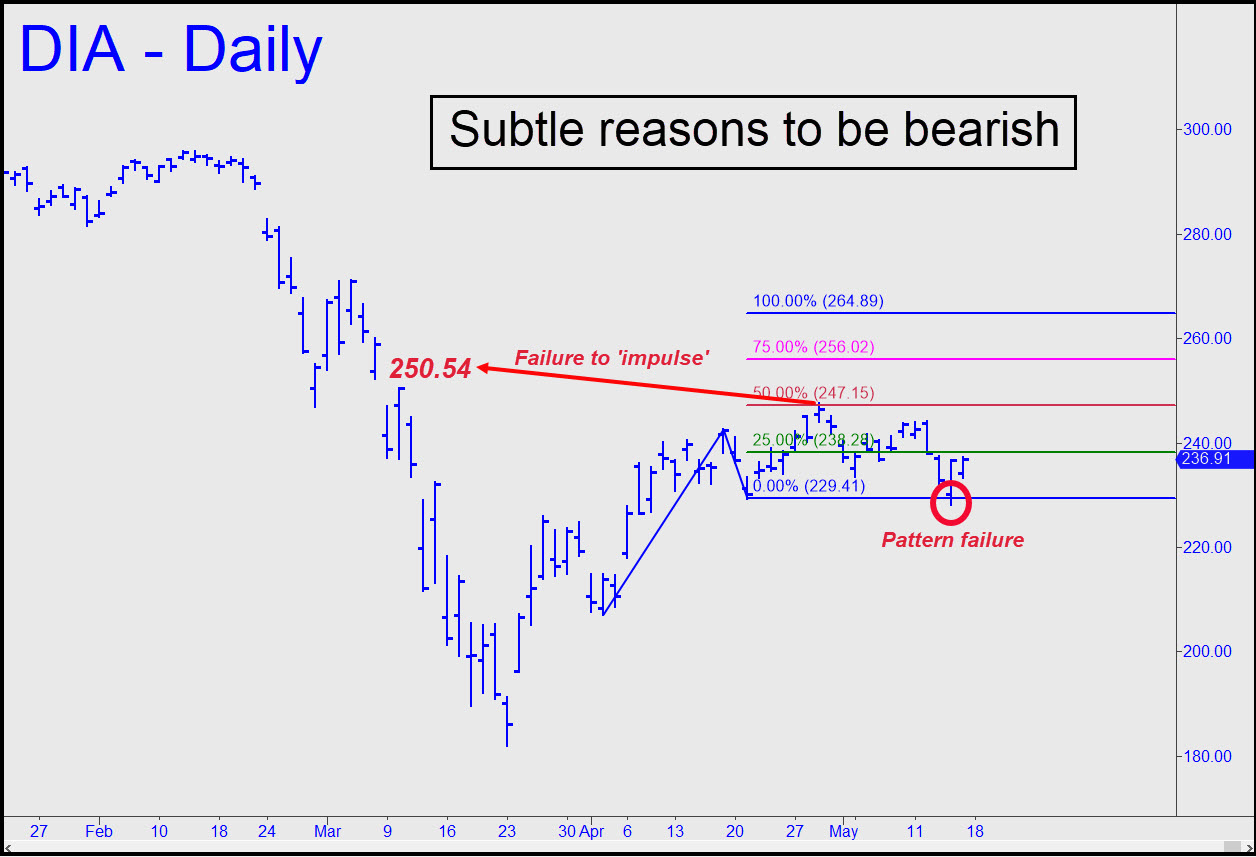
 DIA’s chart is more clearly bearish than the one currently featured in conjunction with the E-Mini S&P tout. The former looked undeniably bullish at April 17’s 242.66 peak, since the impulse leg that created the point ‘B’ high had exceeded the required internal and external peaks. The B-C leg stalled at 247.67, slightly above at p=247.15, validating the pattern. But consider what happened next: Two waves down this month ultimately breached the point ‘C’ low, negating the bullish pattern. So why not simply draw a new bullish pattern using 247.67 as ‘B’ and last week’s low at 228.30 as ‘C’? Answer: because the 247.67 high failed to ‘refresh’ the bullish energy of the daily chart by exceeding an ‘external’ peak — in this case 250.54 — as we require. This may sound esoteric to those unfamiliar with the finer points of Hidden Pivot analysis, but the bottom line is that it allows a much clearer, bearish interpretation than is possible with the E-Mini S&Ps. There is a weak technical divergence between the two, but that is sufficient to tip the balance in favor of bears. We can trade DIA from either side of the market nevertheless as opportunities arise, but with a somewhat more negative bias than in the E-Mini S&Ps.
$DIA – Dow Industrials ETF (Last:236.91)