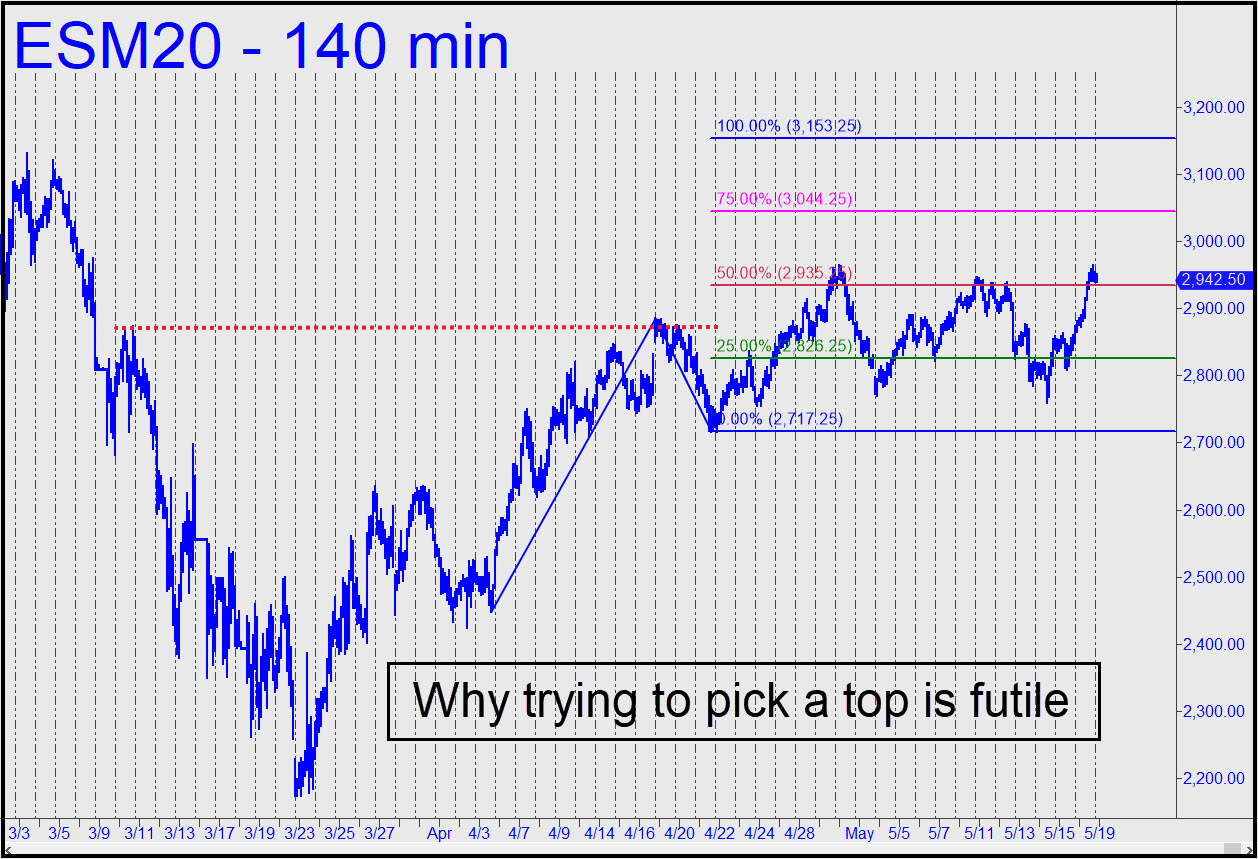
 The chart show the pattern I would suggest using if you want to trade ES right now, or at least avoid getting on the wrong side of it. This isn’t rocket science, and you need to put aside the intimidating fact that the ups and downs comprise the biggest market swings, measured in points, that have ever occurred. They are no different, as far as we should be concerned, from the patterns we would use on the 5-minute chart to trade and forecast. Note that the D rally target still leaves room on the bearish chart displayed here yesterday to allow a 200 point rally and still be bearish. I went with the bearish pattern first because I did not imagine a rally would occur so soon that would be big enough to tip me bullish.
The reason I am so confident in this chart is that its point B high is legitimate, meaning it is not ‘sausage’, having slightly exceeded an ‘external’ peak well to the left. I am making no effort to comprehend the silliness of what is going on here, other than in purely technical terms. You should get it out of your heads that what is happening on the charts needs to be tied to economic reality. I am not thinking about reality, just reading the stupid chart. It says what it says, and I you needn’t seek answers beyond it to make money and/or preserve capital, our main objectives. We can trade the bejeezus out of it using the same tactics we would on the five-minute chart. At the moment, the best way to cut risk down to size is by using the lesser charts to create set-ups at turning points on bigger charts.
Here’s a note to ourselves for later (shades of Unk!): If and when the futures get to 3153.25, don’t think that shorting up there will necessarily produce free money. Better yet, act as though ES actually will hit that goal and make yourself a sweet $5100 per contract on the way up. Do this and I promise that when it comes time to pick yet another top and get short, you’ll be much more relaxed about it.

