
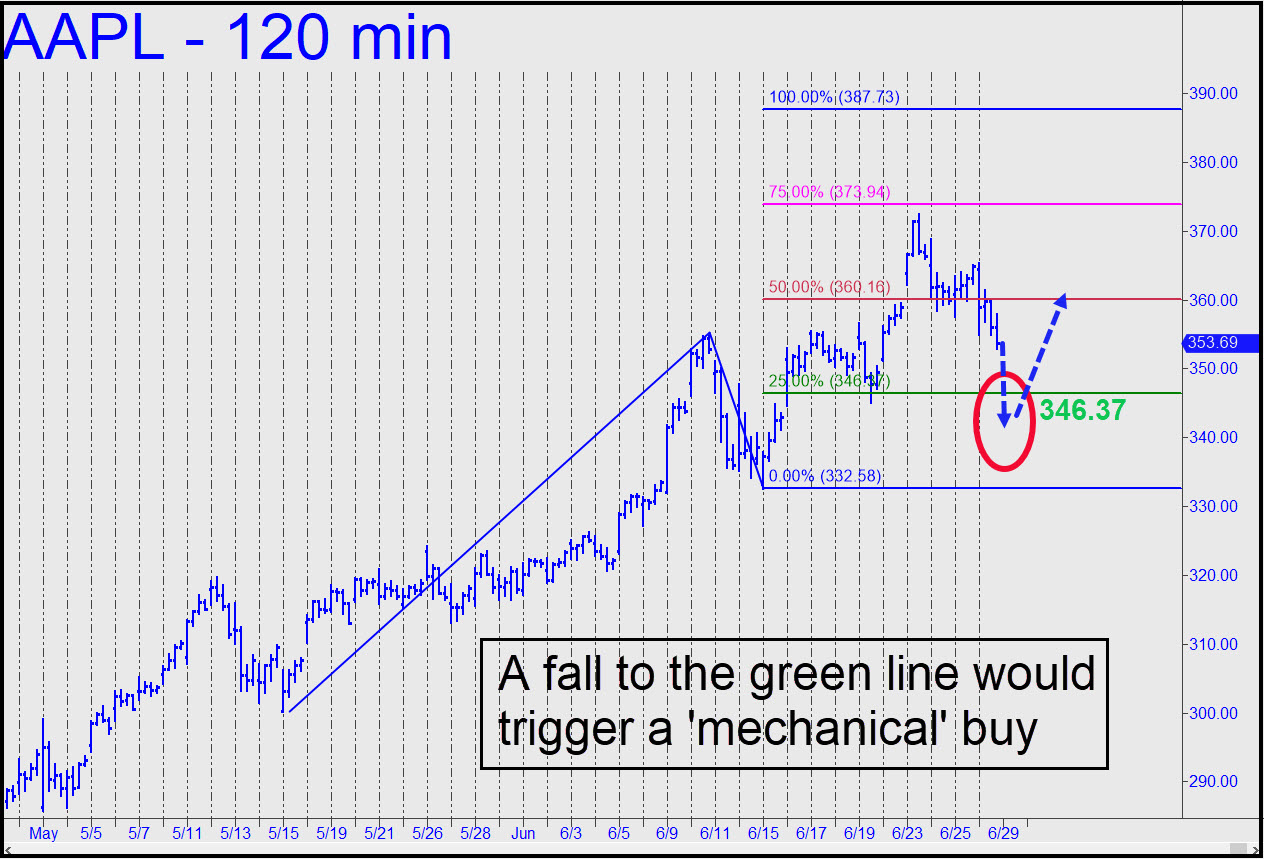
 A fall to x=346.37, the green line, would trigger an enticing ‘mechanical’ buy with a stop-loss at 332.58. The initial, theoretical risk on 200 shares would be almost $2800, so this trade is not for everyone. However, mechanical set-ups have been working consistently in this stock, as anyone who has followed my recent touts may have noticed. I might be able to substitute call options for stock, but please note that the green line should not be used or thought of as a support or a Hidden pivot whence AAPL is likely to bounce, since it is neither. Stay tuned to the Trading Room if you care.
Focusing on a much bigger pattern, last week’s top an inch from a clear and compelling target at 370.16 is good reason for caution. It could mark the top of AAPL’s insane rally, and therefore a possible top in the stock market. The smaller ABCD pattern that had led me to project 385.48 remains sufficiently persuasive nonetheless to keep that target theoretically in play. We’ll be better able to weigh the odds once we’ve seen some downtrending abcd patterns play out. If they easily exceed their ‘d targets, it would affirm the bearish outlook. ______ UPDATE (June 29, 9:57 p.m. EDT): The downtrend didn’t play out at all, but I don’t see the uptrend going anywhere either. ______ UPDATE (Jul 1, 12;23 a.m. EDT): A push above last week’s record-high 372.38 would make a further run-up to 385.48 an odds-on bet. _______ UPDATE (Jul 1, 9:55 p.m.): The stock has shown poor relative for two days. Although it may need a pullback for a running start into the next leg up, if weakness brings it down to x=358.09 in this chart, that would trigger an appealing ‘mechanical’ buy at 358.09, stop 351.27.