
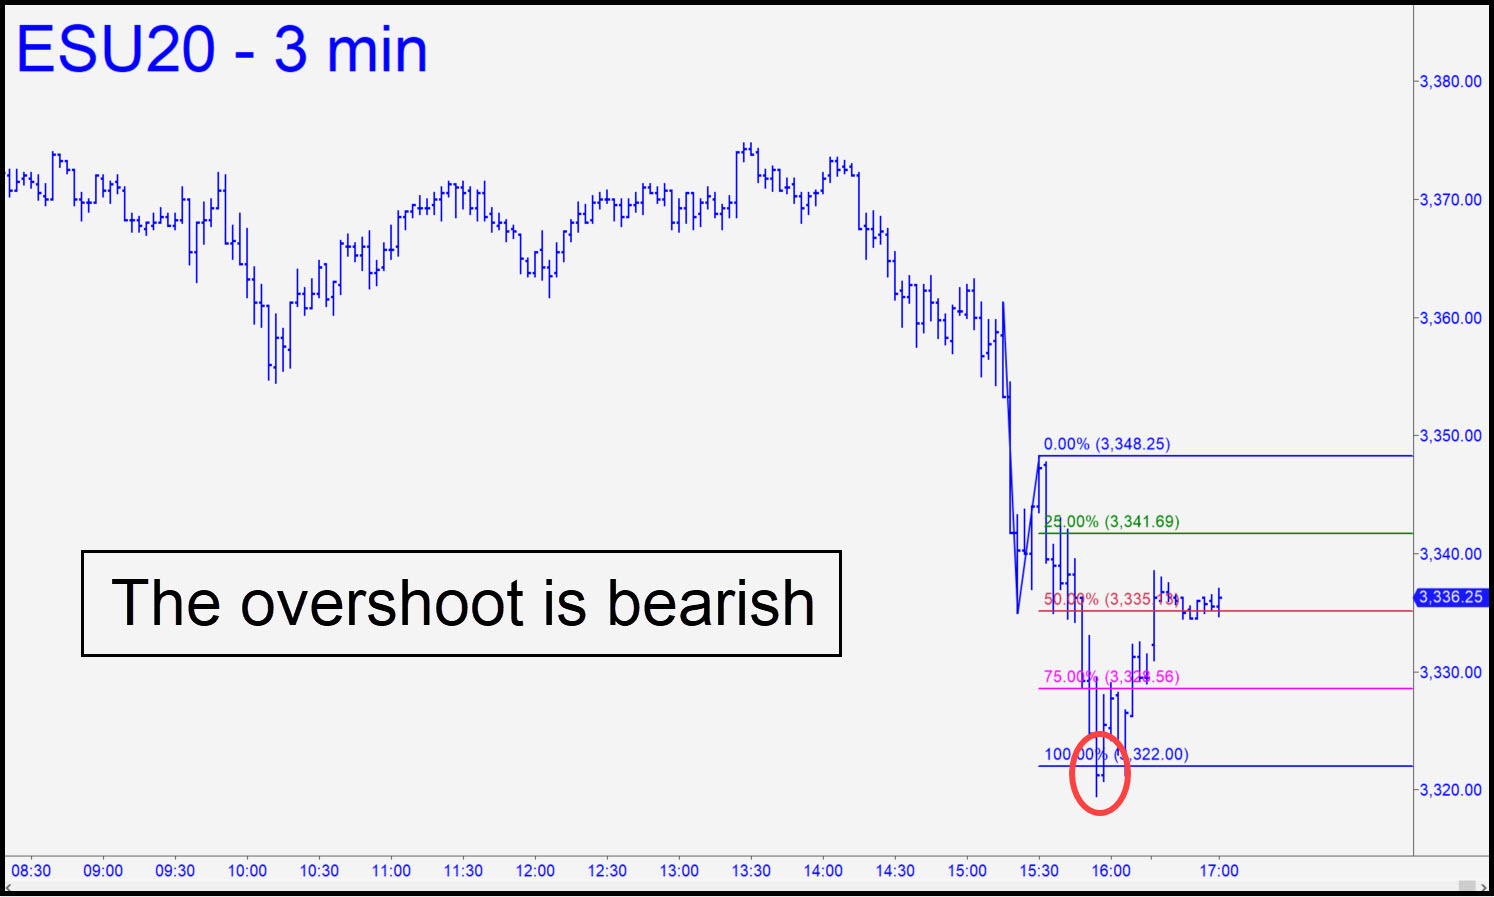
 Short covering toward the end of the session recouped about 20% of the day’s losses, but not before sellers had damaged the intraday charts by overshooting a clear Hidden Pivot support at 3222.00. Looking just ahead, a corresponding failure of minor uptrends to reach their ‘D’ targets would provide further evidence that the dominant trend may have shifted to bearish. Bulls could remedy that quickly with a thrust exceeding 3361.25 overnight or Wednesday morning, but if they fail, look for the futures to grope their way down to at least 3300 in search of support.______ UPDATE (Aug 12, 4:32 p.m.): What on earth could I have been thinking? A guy would have to be crazy to expect the S&Ps to fall for more than a day. Wednesday’s ratcheting short squeeze managed a new record high, a presumptive installment on the 3398.00 target shown in this chart. Look for a tradeable pullback from that number, but don’t expect it to last. _______ UPDATE (Aug 13, 11:14 p.m.): I almost forgot about an even more compelling target at 3392.75 that I began drum-rolling in June. It’s shown in this chart, and I’ll be surprised if buyers turn it into the usual chopped liver. Combined with the lesser ‘D’ target at 3398.00 noted above, along with February’s record high for good measure, and you have a 40-foot thick slab of concrete supply just above. The futures might poke past it briefly, but it seems most unlikely to me that they will simply blow past it and keep going. If they merely pussyfoot in a range between the two targets on Friday, I’d suggest taking home a few SPY or DIA puts over the weekend. We are going up against the steepest, most powerful rally in history, so don’t bet more than you could afford to kiss goodbye.
ESU20 – Sep E-Mini S&P (Last:3370.00)