
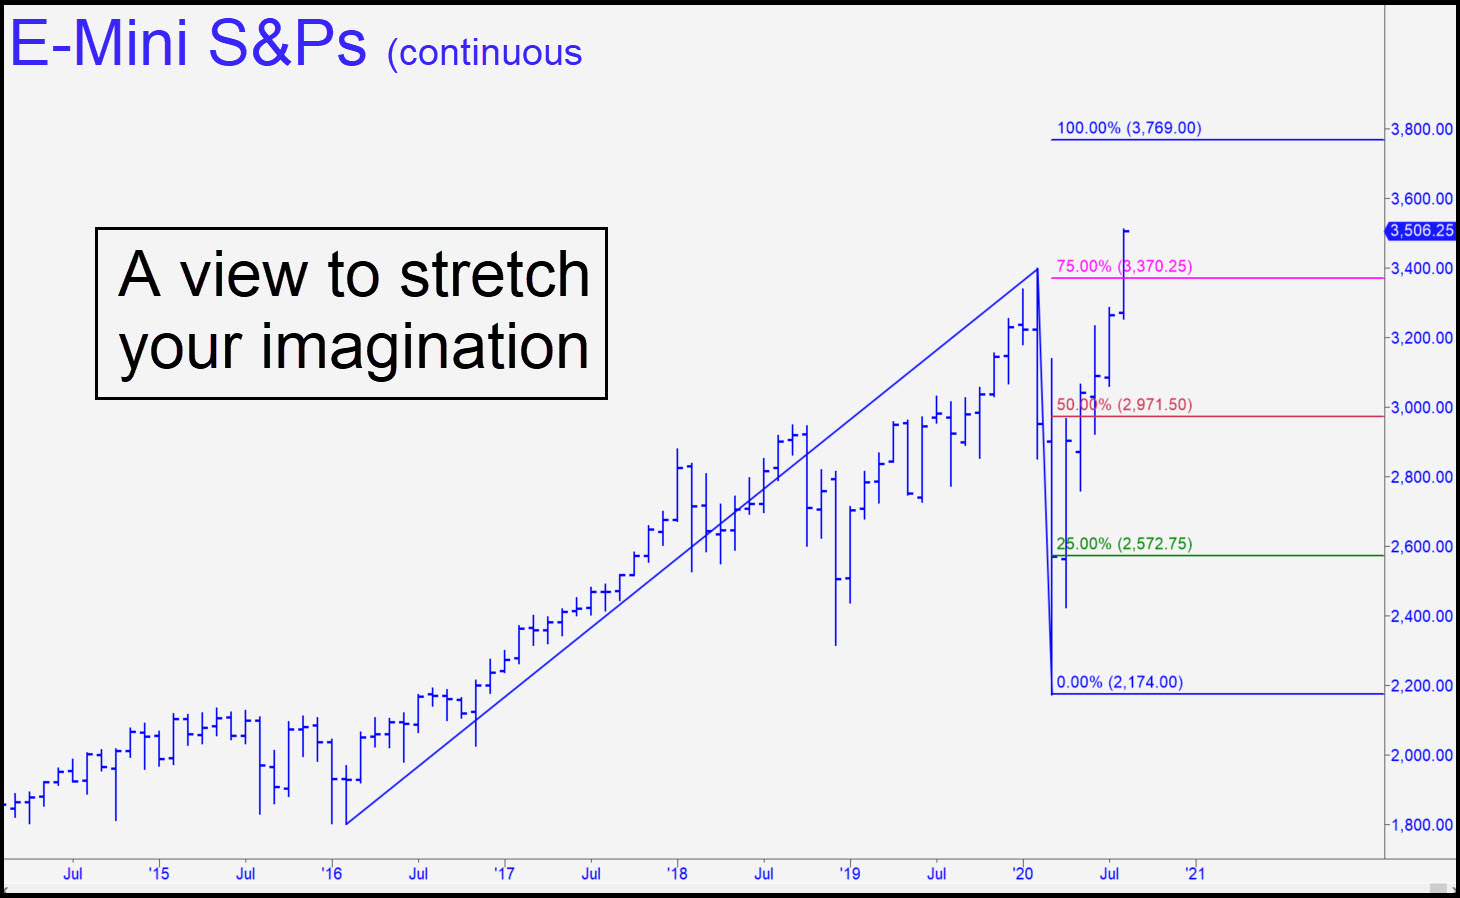
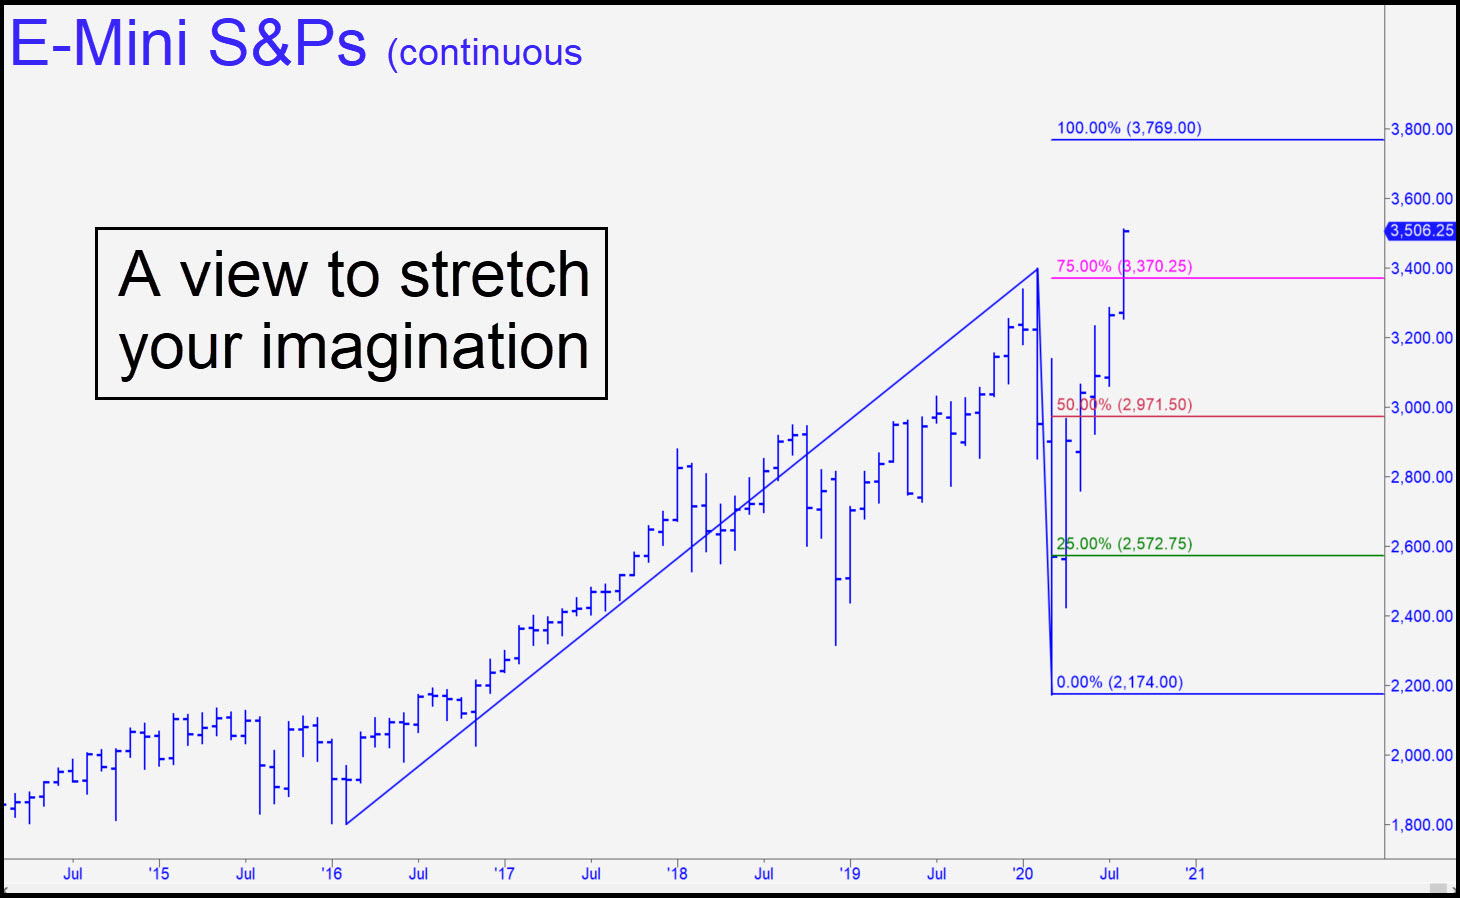
 Rallies are reaching major and minor Hidden Pivot targets consistently and precisely, but without pausing for long before ascending to the next. The pattern shown, with a 3769.00 target, is intended to stretch the bullish imagination, especially if you think the threat of a global depression is bad for stocks. I’ve used the monthly chart because the weekly and daily bars yield too many possible point ‘A’ lows to enable a confident target projection. If the futures hit 3769, the Dow would be trading for around 31,000, about 2,300 points above current levels. How likely is the S&P target to be reached? I’d say there’s at least a 75% chance, given the way buyers impaled the secondary pivot, p2=3370.25, last week. If there is first a plunge to the 2971 midpoint pivot, although that might seem like the end of the world, the chart says it would offer a great ‘mechanical’ buying opportunity.
Although we’re unlikely to see such weakness, it’s potentially useful to know that a seeming avalanche would likely be merely corrective rather than the start of a bear market. Everybody has been expecting one, but that’s one of the reasons stocks just keep moving higher. We’ll look for trading opportunities on the lesser charts in the meantime, maintaining a bullish bias unless corrective patterns on the daily chart start exceeding midpoint pivots and d targets. Please note that the Hidden Pivot levels in the chart will not be as precisely tradeable as usual, since the chart is a composite that uses A,B and C coordinates from contracts of various months and years. However, the ‘composite target’ should be sufficiently accurate to allow us to stay confidently with the trend until the futures are very close to a potential major top. _______ UPDATE (Aug 31, 4:43 p.m. ET): An uncorrected 30-point drop would generate an impulse leg, but also the first sign of trouble on the hourly chart. I mention it because ‘trouble’ is about the last thing on my mind these days. A practical implication is that we’ll think twice about doing a ‘mechanical’ buy if the futures fall to the red line. _______ UPDATE (Sep 1, 5:27 p.m. ET): Shhhh! There’s double resistance just above in the form of two Hidden Pivot ‘D’ targets. The first, at 3543.25, comes from a minor pattern and is straightforward; the other, at 3545.50, culminates a gnarly, unintuitive pattern stretching back to late July. It is the highest target that I can projected using the hourly chart. Here’s it is. Together, the hidden resistances are very likely to show tradeable stopping power that is best shorted using an rABC pattern with a point ‘c’ high in-between. I particularly like this trade because the pivots are so obscure and unadvertised. The bull trade enroute to the targets cannot miss, since they will be reached, if not exceeded.