
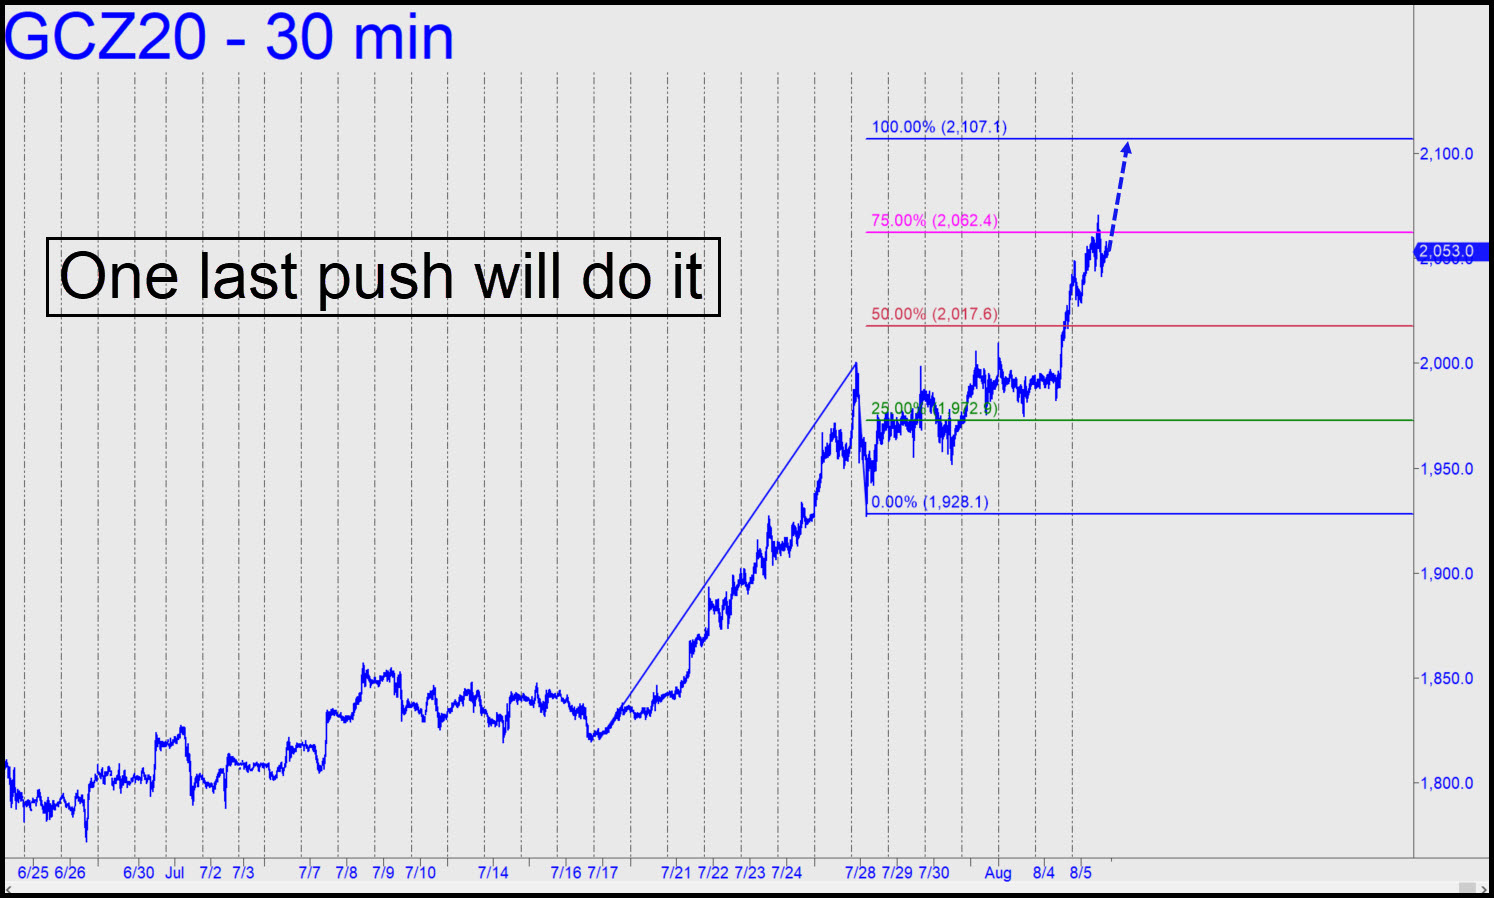
 I’ve swapped out the October chart for December, since that’s where the action is. The 2107.10 target is $16 higher than the old one, but the implications are the same. Given the steepness of the impulse leg that unfolded during the last two weeks of July, a pullback to p=2017.60 would set up an enticing ‘mechanical’ buy, stop 1987.70. Since Mr. Market is unlikely to gift us with such a juicy opportunity, we’ll need to pay close attention to smaller entry patterns at these levels, particularly rABCs on charts of 15-minute degree or less. There is one such set-up at the rightmost edge of the chart shown, with an ‘A’ low at 2044.40 (9:00 a.m.). Entry would have come at 2046.40, stop 2941.80.
GCZ20 – December Gold (Last:2053.00)