
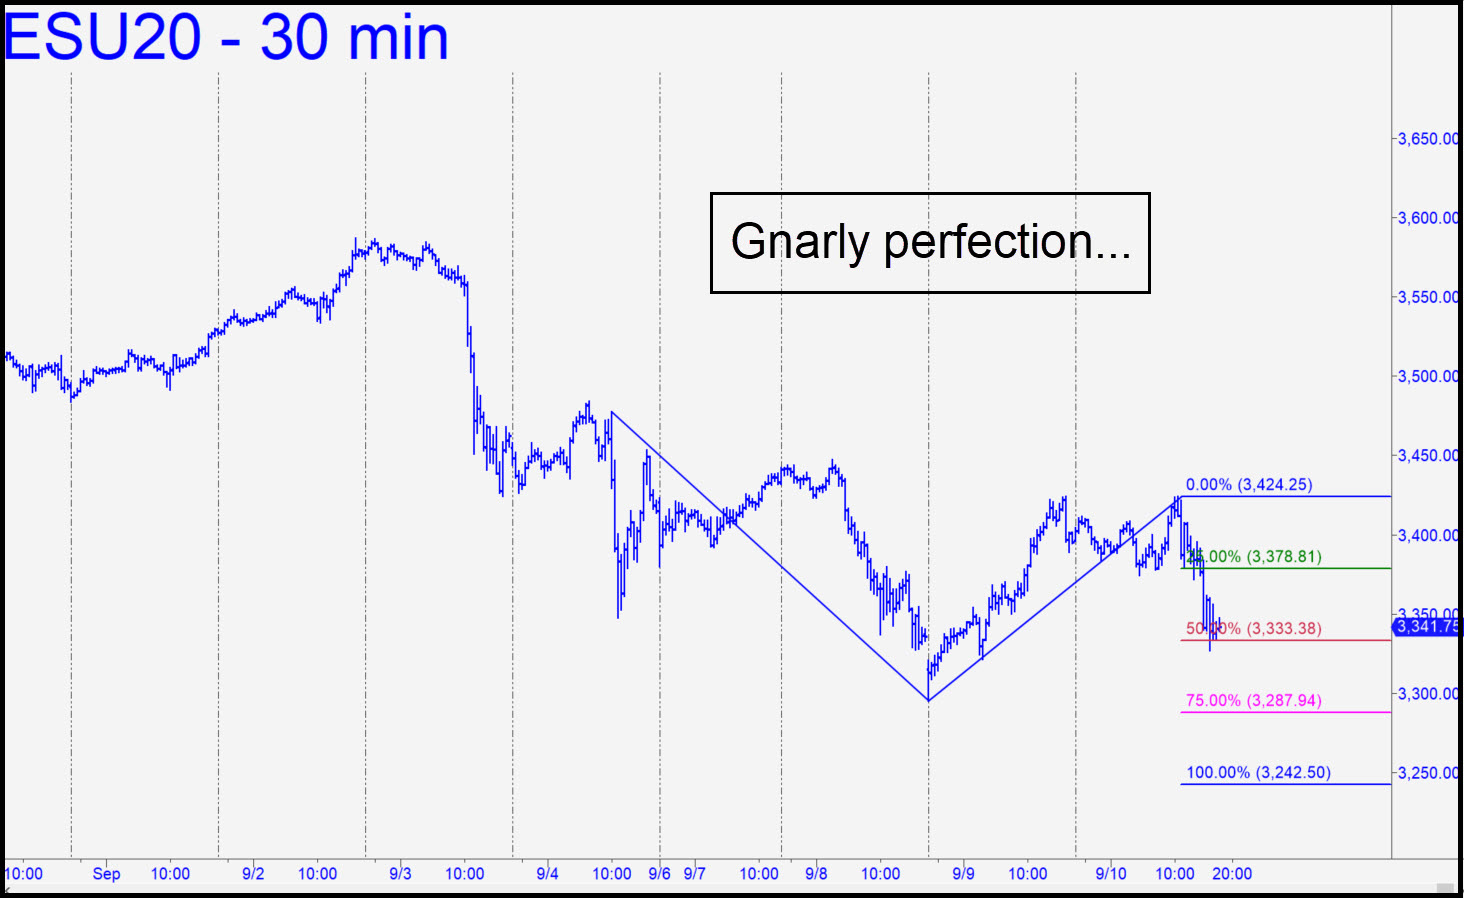
 The pattern shown is gnarly perfection, and it could spell easy opportunity on Friday. Everything about it is textbook, and although the external low surpassed by the point ‘B’ low is well to the left and not shown, it is most definitely there and distinctively so. The key here is that virtually no one but us sees this pattern. This implies that ‘mechanical’ longs or shorts will work from x, p or p2, and that D= 3242.50 can be bottom-fished with a very tight stop-loss (or an rABC set-up). Stay tuned to the Trading Room for details, since anyone who posts with a blue ‘handle’ should be able to navigate the set-up mechanics.
Lately, I’ve remained inured to the noise of strong rallies and nasty sell-offs, since they are setting up a bigger deception. I detailed one such scenario here the other day, illustrated with a chart of IBM’s crash in 2007-08. The takeaway is that if this selloff continues, we should be prepared for a wicked turnaround that will send the broad averages to new record highs. Things might not play out exactly that way, but however they develop, the effect will be for the bear market to take as many investors down with it as possible. Right now, there is a mix of bulls and bears; however, for a proper top, EVERYONE — including short-covering bears — will need to be crazy-bullish.