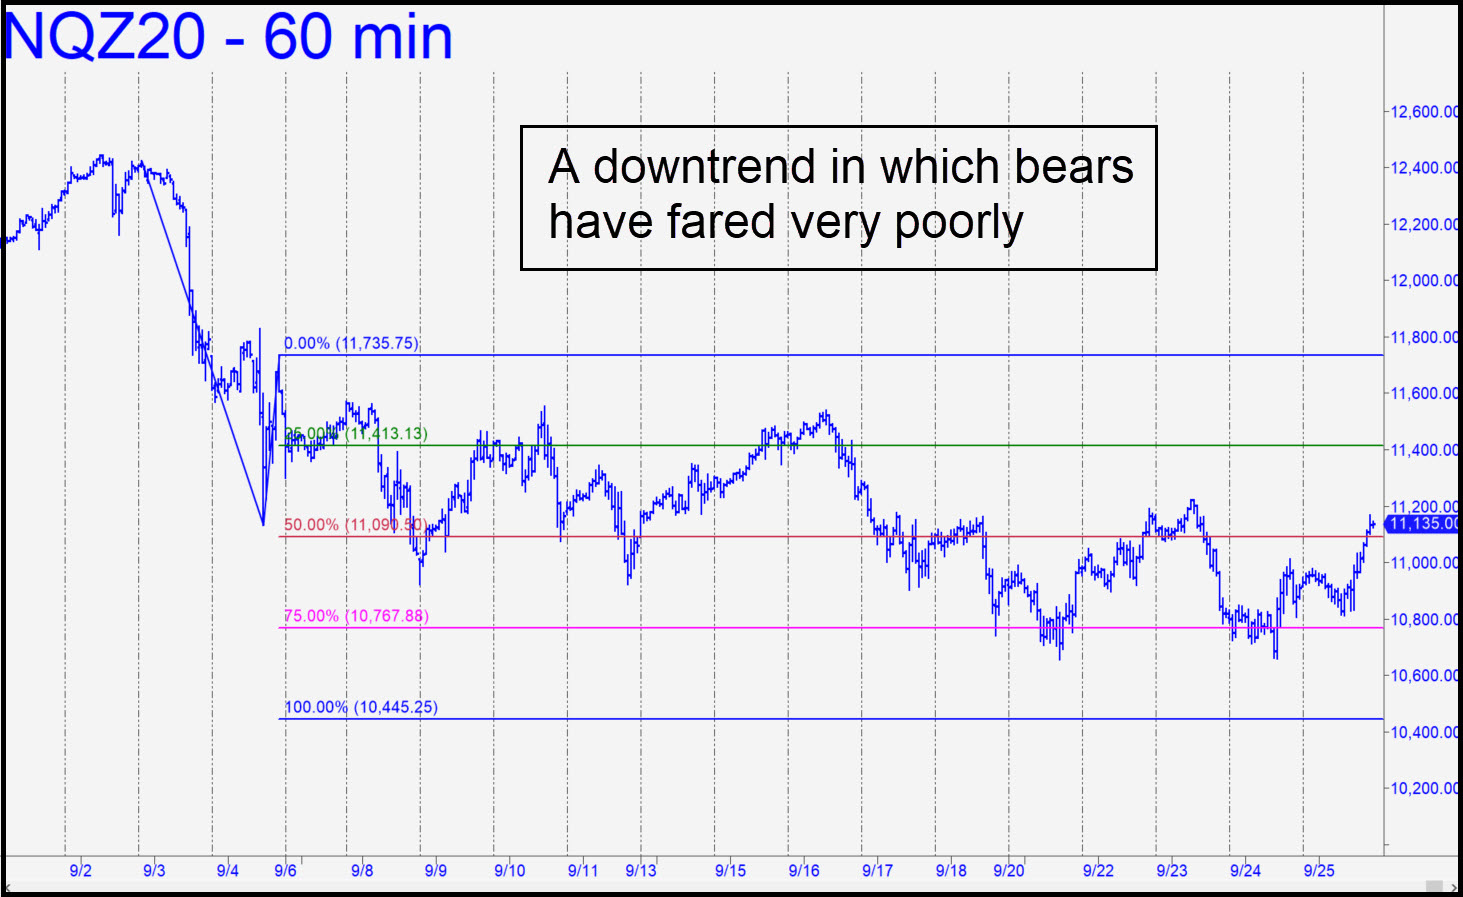
 The bearish pattern shown, with a 10,445 target, looks quite serviceable and should have worked perfectly. The trouble is, after tripping a theoretical sell signal at 11,413 way back on on September 6, the futures have spent three weeks avoiding the target as though it were a tar pit. It remains valid nonetheless and should work nicely as a back-up-the-truck support for bottom-fishing if hit on Monday. I should also mention that virtually every ‘mechanical’ short signaled on this chart since Sep 9 would have produced a profit of around $6500 per contract, albeit it with commensurate risk. The next ‘mechanical’ short would be signaled on a run-up to x=11,413, but this would be, not sloppy seconds, but sloppy thirds, and so I am not recommending the trade. The many failed attempts to go lower would seem to argue for a bullish bias, and that is indeed where we will point when the new week begins — on the lesser charts, perforce, since the larger ones all say NQ is still a sale. ______ UPDATE (Sep 29, 6:33 pm. ET): The very sloppy price action of the last three weeks has not yet invalidated the bearish target at 10,445, but we will pass up this foul-smelling temptation to get short nonetheless. _______ UPDATE (Oct 1, 6:20 p.m.): The rally feels unstoppable, doesn’t it? If this one’s going to fail, the logical place for it to happen would be just above C=11,735 (see inset). We’ll be waiting with a small-interval rABC pattern to get short with a penny-ante stop-loss..
NQZ20 – Dec E-Mini Nasdaq (Last:11,589)
 Posted on September 27, 2020, 5:05 pm EDT
Last Updated October 1, 2020, 6:21 pm EDT
