
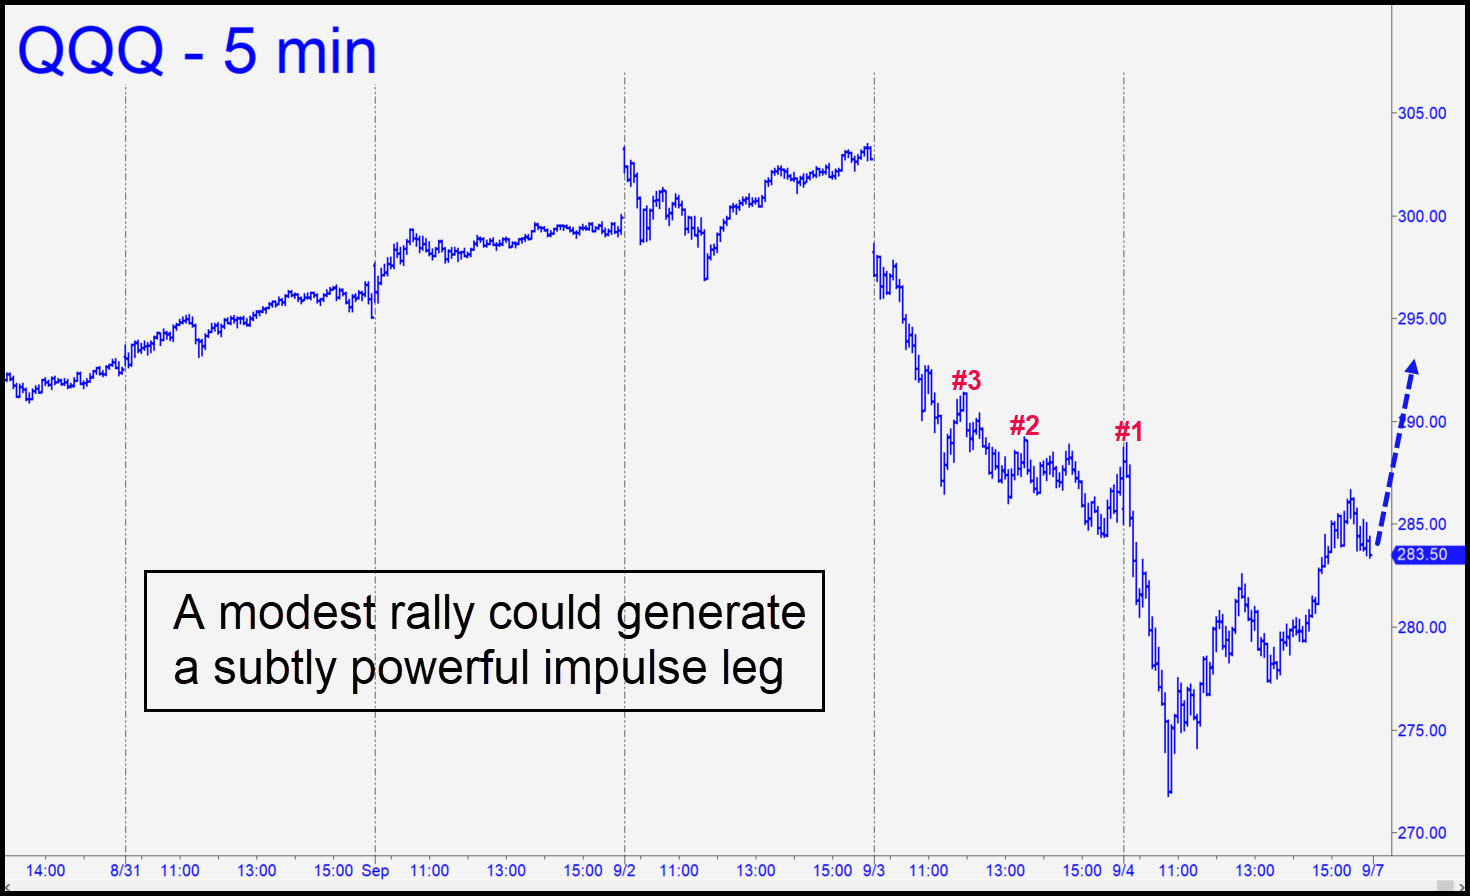
 Like AAPL and the Dow Industrials, the Cubes could generate a powerfully bullish impulse leg with a relatively modest rally past the three small ‘external’ peaks shown in the chart (inset). The highest lies at 291.38, and it is equivalent to a peak at 11,944, basis the September E-Mini Nasdaq contract. On Friday, following two-and-a-half days of hard selling, QQQ rebounded sharply but without exceeding any external peaks. That may or may not happen when post-holiday trading resumes, but we should be ready for it nonetheless and open minded about the very bullish implications it would have for tech stocks, particularly the FAANGs. Alternatively, if QQQ opens lower, it could still be bought with a very tight stop-loss at p=278.10 of this pattern on the five-minute chart; a=288.93 at 9:40 a.m. on 8/4; b=271.80 at 10:45 a.m.; and c= 286.66. _______ UPDATE (Sep 8, 8:59 p.m. ET): The Cubes opened on a gap BELOW p=278.10, telegraphing the weakness that followed. The bottomed occurred exactly at the pattern’s D target, but I doubt the selloff is over. Raising the point ‘A’ to 303.50 yields minimum downside to p2=262.89, or D=254.96 if any lower. _______ UPDATE (Sep 9, 11:30 p.m.): Use the 281.36 ‘D’ pivot shown in this chart as a minimum upside target for the near term. Bulls should have been able to do better, given the shock-and-awe, short-squeeze opening. Is the rally a fake? We should know by day’s end. _______ UPDATE (Sep 10, 10:11 p.m.): The double fist-pump to just above the 281.36 rally target in the first hour was sufficient to scare off even the most determined bears before the Cubes tanked. They looked bound for at least D=265.20 (5-min, a= 286.66 on 9/4) at the close.
QQQ – Nasdaq ETF (Last:272.16)