
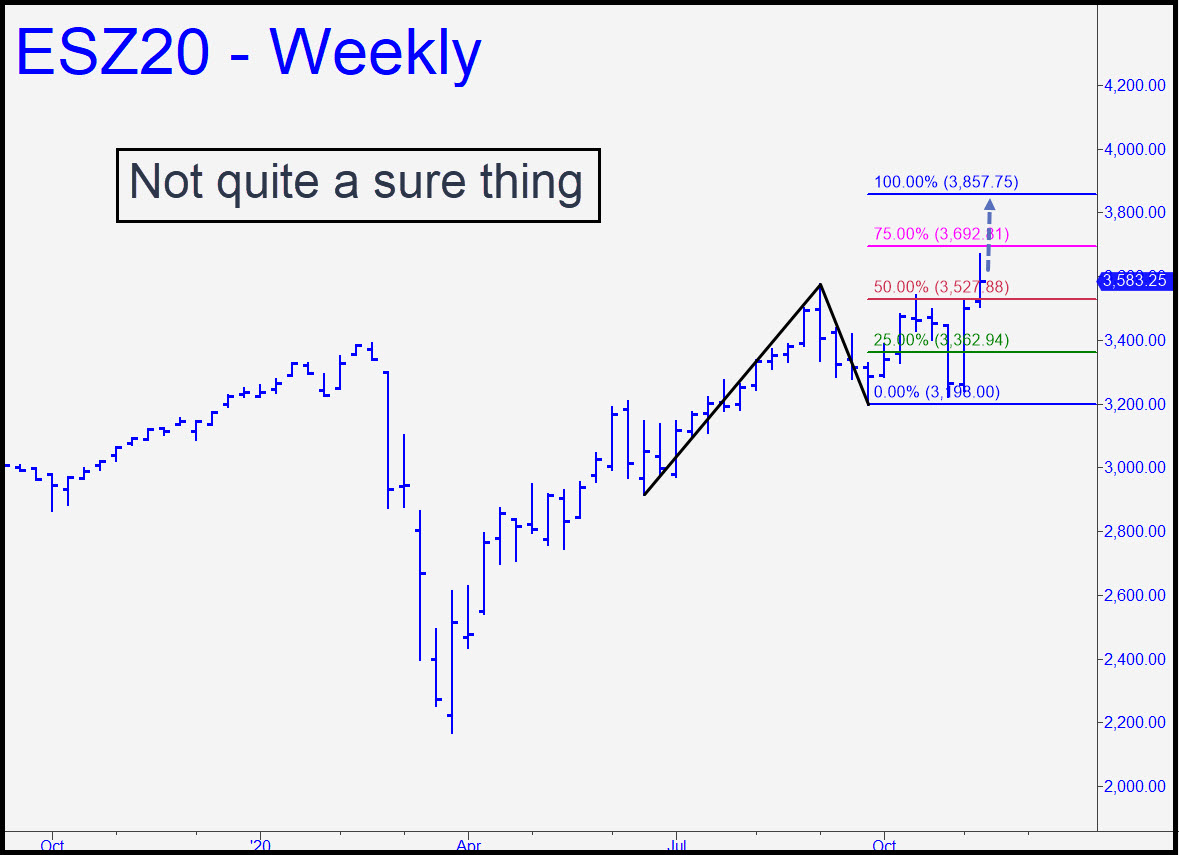
 I’ve used a long-term chart not only to show an obvious and somewhat ambitious rally target at 3857, but the decaying pattern that produced it. It has already signaled a profitable ‘mechanical’ buy once at the green line (x) and would do so again if the futures were to revisit it. Although the pattern would have produced a solid profit for ‘mechanically’-minded bulls, its strength has deteriorated, along with the prospect of effortless gains on the long side. Notice that the futures were unable to reach the mechanical trade’s ‘sweet spot’ above the red line before relapsing to x. Also, anyone who got long at x would have suffered considerable pain on the pullback to within an inch of the 3197 stop-loss. Another sign of, if not weakness, then reluctance, is last week’s failure to reach p2=3693 (the pink line). This implies that weakness and uncertainty are gaining a hold even if there is still a perhaps 70% chance of ES reaching the target. Our trading bias should remain bullish accordingly, but less aggressively so than during last summer’s run-up. _______ UPDATE (Nov 16, 7:25 p.. ET): Buying interest has been so relentless that “less aggressive” trading is guaranteed to miss the boat. At least we know where ES is going. ______ UPDATE (Nov 17, 7:47 ET): We’ll step back as ES takes the measure of a potential obstacle in the form of p2=3648. A pullback to p=3498 would trigger a ‘mechanical’ buy with a stop-loss at 3398.00. ______ UPDATE (Nov 19, 8:34 p.m.): Use a low-level rABC set-up to get long once the red line has been touched, but don’t attempt it if you’re not up to speed with this tactic.
ESZ20 – December E-Mini S&P (Last:3557)