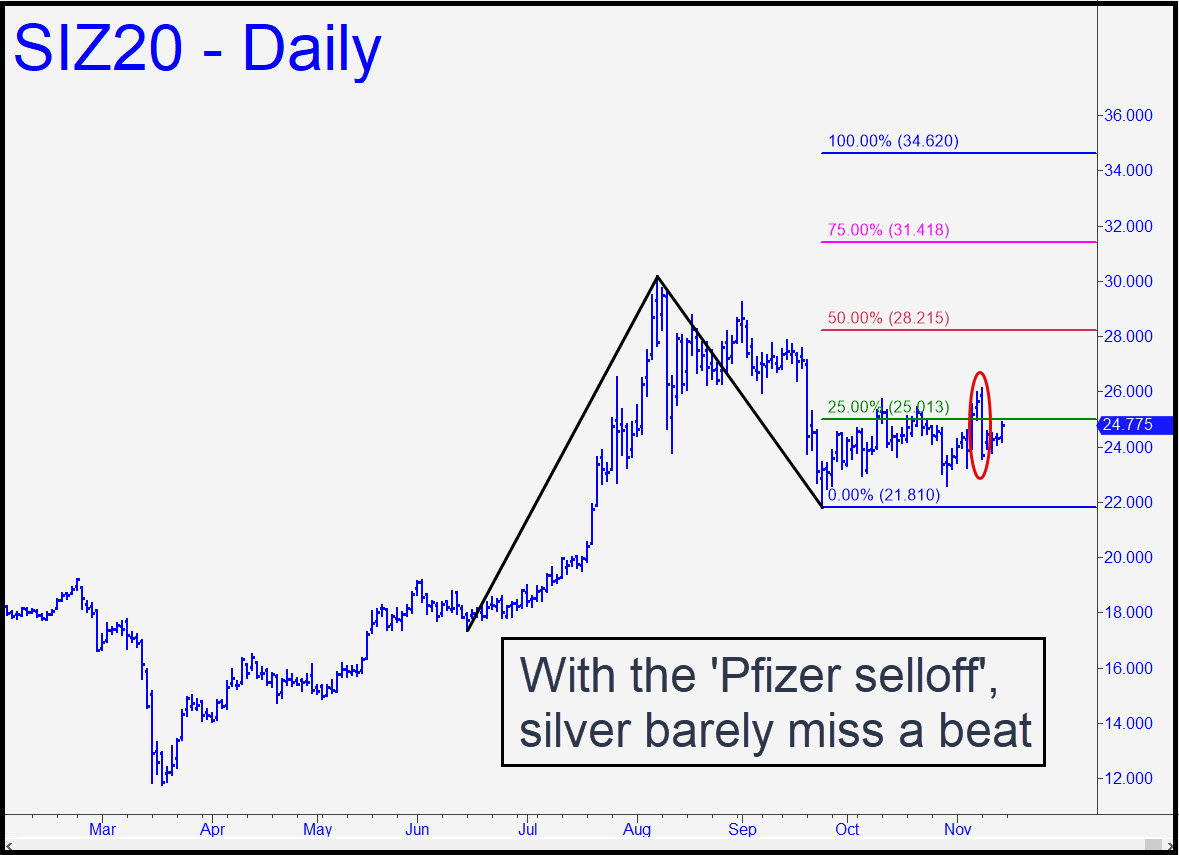
 Silver’s daily chart looks even less disturbed than gold’s following last week’s hit-job on bullion. The commercials reportedly were heavily short, and they used an extremely volatile day in the stock market to make traders think news of a Pfizer vaccine was somehow bearish for precious metals. Their ploy worked for all of a day, but buyers were back at it the next, struggling to recoup lost ground. A theoretical buy signal remains in effect, predicated on minimum expected upside to p=28.22. We’ll have to see how the uptrend interacts with that Hidden Pivot if and when it is reached, but an easy move through it on first contact would shorten the odds of a further rally to as high as D=34.62. ________ UPDATE (Nov 18, 8:44 p.m. ET): There’s a midpoint Hidden Pivot support at 23.93 that looks opportune for bottom-fishing with a tight stop loss. To reduce the entry risk, I’d suggest using an rABC set-up with the coordinates shown to do the trade. Initial risk would be about $700 per contract. A comparable support in SIL lies at 41.62. _______ UPDATE (Nov 19, 10:13 a.m.): Using the rABC pattern sketched out above, you’d be up about $1300 per contract at the moment. The first entry stopped out for a $700 loss; the second, for a $700 gain; and the third is still live, just shy of p2=24.07. Based on four contracts, the third should be exited at p2, and the fourth at D=24.215 of the rABC. I would NOT be swinging for the fences here because p=23.93 of the big pattern — my original ‘buy’ level — has been badly mauled. This implies SI will fall o at least p2=23.318 of the big, bearish pattern against which we are trading; or even to D=22.70.
SIZ20 – December Silver (Last:23.95)
 Posted on November 15, 2020, 5:10 pm EST
Last Updated November 19, 2020, 10:29 am EST
