
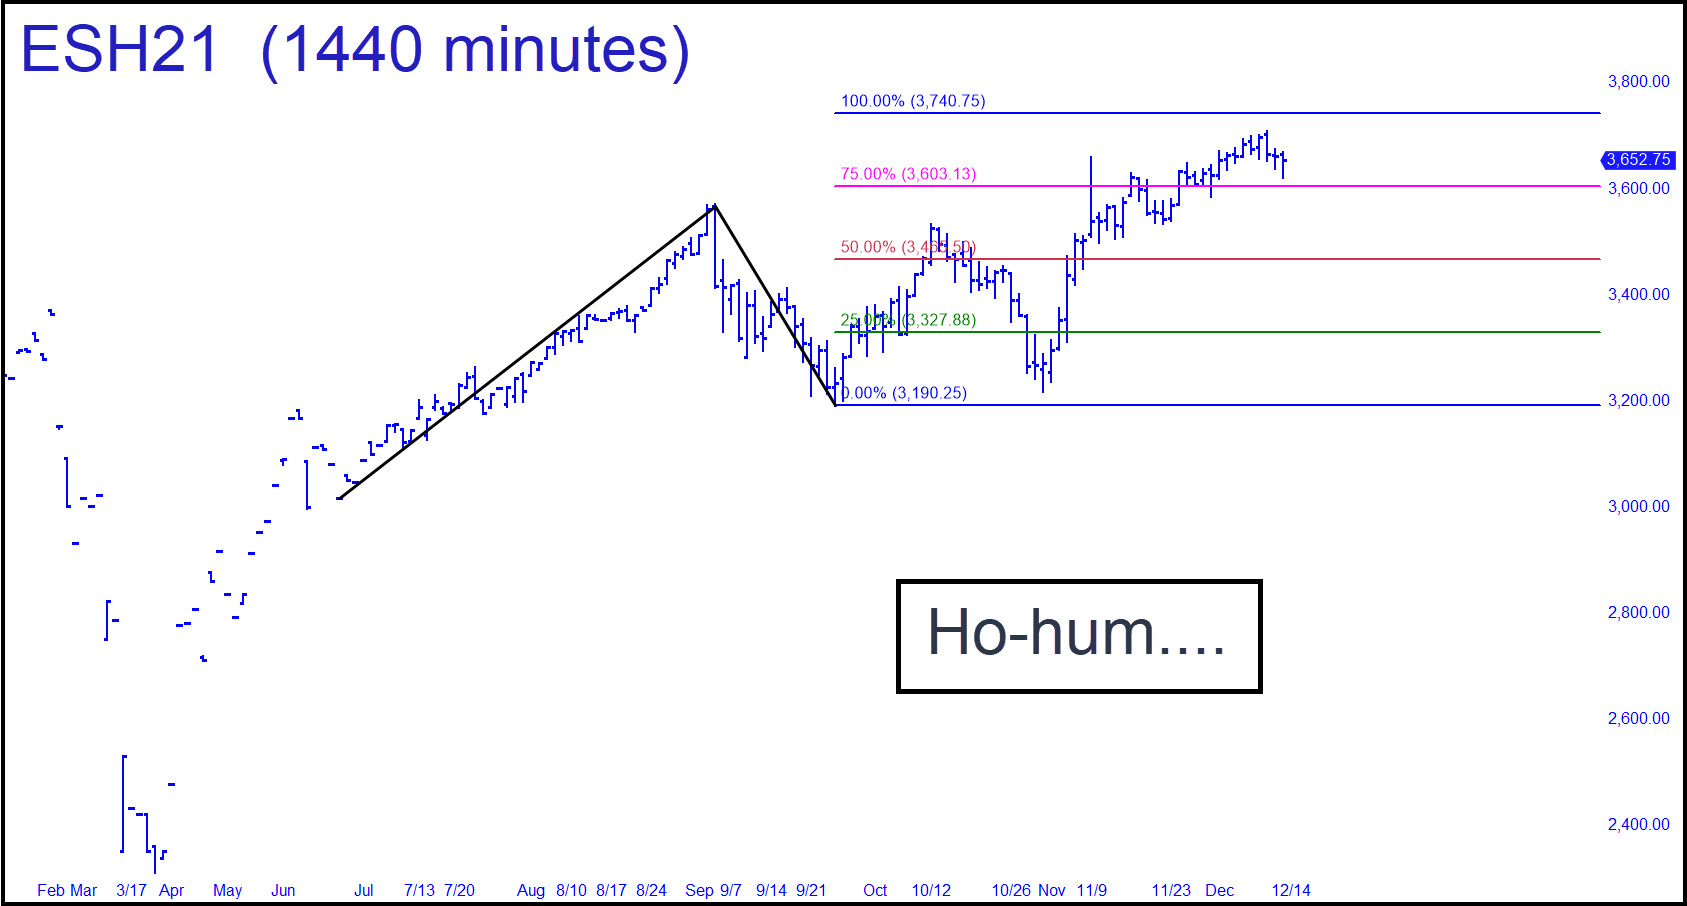
 Ho-hum. The futures have been plodding toward a 3740.75 target since late September, pausing for nearly two weeks in October in order to scare the hell out of anyone who briefly may have lost faith in the Fed’s ability to control…everything. I’ve commented in the chat room on the pattern shown in the chart, although the target has been revised slightly. My point ‘A’ low is not as well developed as I would prefer, but its June 25 date corresponds to one in the December chart that is a picture-perfect. A pullback to the red line would be read by most market-watchers as a possible disaster in the making, but my perspective is that it would offer a pretty good ‘mechanical’ buying opportunity with a stop-loss at 3373.75. _______ UPDATE (Dec 14, 8:47 p.m. EST): I hadn’t noticed the subtle point ‘A’ low in this chart, but the fact that it exists, however ineffably, suggests we should be on our guard now that the rally has topped at the target. _______ UPDATE (Dec 16, 9:04 p.m.): Here’s a pattern I posted in the chat room at the start of the day with a 3843.50 target that leaves some room if, as appears likely, the futures continue higher.
ESH21 – March E-Mini S&Ps (Last:3696.00)