
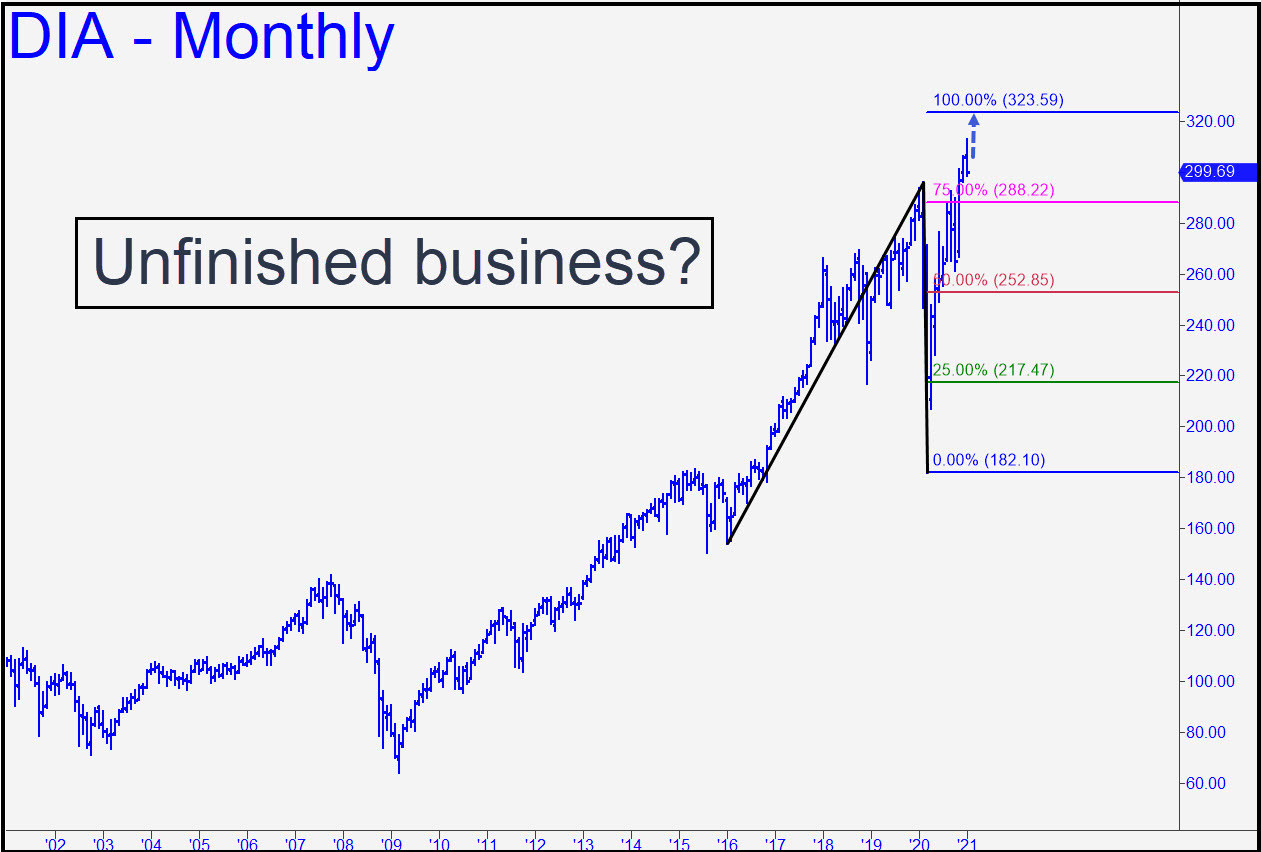
 We hold put positions in several indexes that topped simultaneously at compelling Hidden Pivot targets. This one, however — an ETF proxy for the Dow Industrials — is somewhat out of sync, having failed to reach a clear ‘hidden’ resistance at D=323.59. The actual high at 312.71 is a little more than midway between p2 and D, and, as I’ve mentioned elsewhere, it would not be unusual or illogical for a major trend to fail where this one did. However, the chart still provides the strongest technical evidence we have to reserve at least some small doubt that the bull market top is in. Specifically, the decisiveness of the move past p=252.85 on the way up has raised the odds of a completion to D to around 75%. We’ll give the benefit of the slight doubt to indices that have already reversed and sold down hard, but we should keep a close eye on this potential troublemaker nonetheless. _______ UPDATE (Feb 1, 9:25 p.m. EST): Bulls have a tough climb, given that the most recent down-leg exceeded a key ‘external’ low on the daily chart. This generated a bearish impulse leg that implies any rally that falls shy of 309.43 is merely corrective. ______ UPDATE (Feb 4, 9:20 p.m.): A fist-pump on the open bar pushed DIA above an internal and external peak, generating an impulse leg that will shortly propel this vehicle to new record highs. We shouldn’t fight it, but neither should we trust it, especially with an unachieved target in the E-Mini S&Ps 67 points above, at 3938.25.
DIA – Dow Industrials ETF (Last:310.59)