
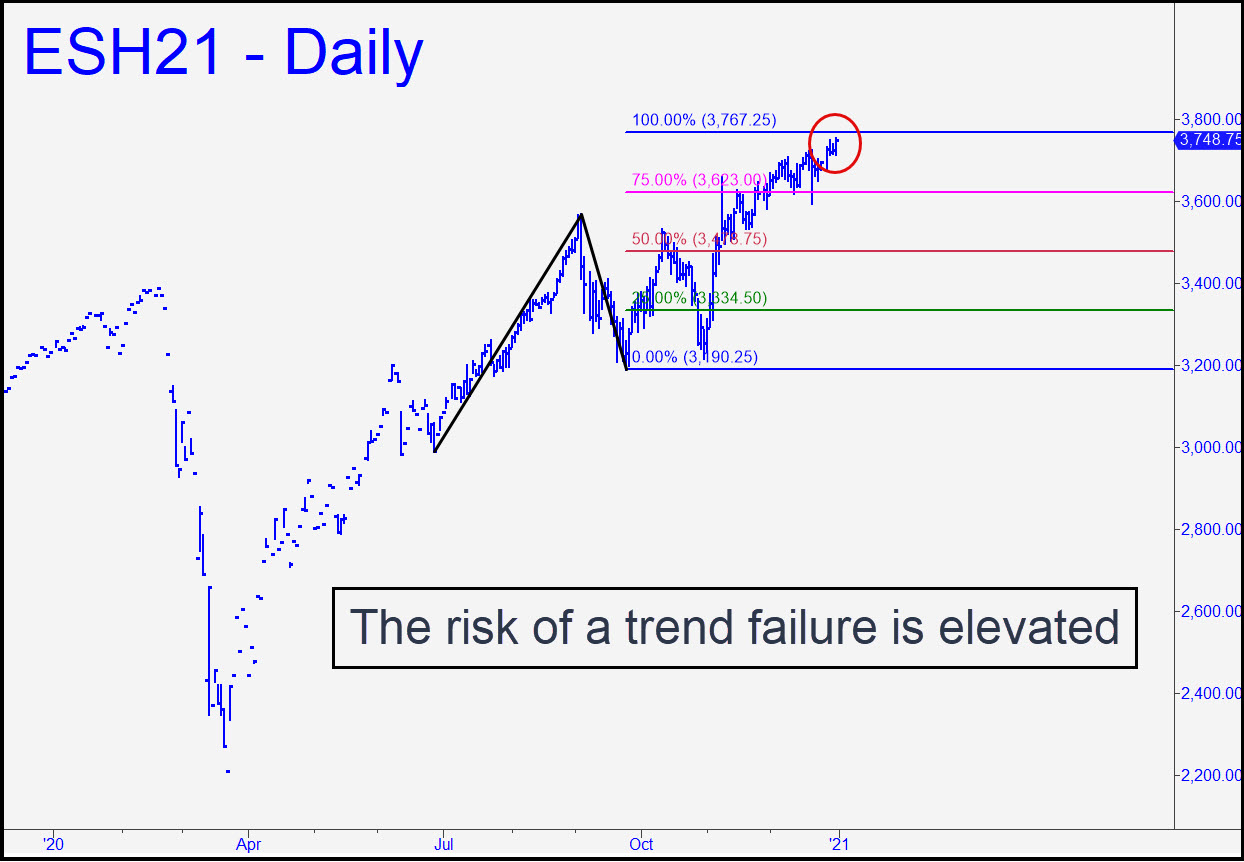
 The futures’ balky approach to the 3767.25 target over the last couple of weeks suggests this ‘hidden’ resistance is not likely to give way easily. Moreover, the pattern itself is compelling and even a little gnarly — enough so that we might infer that a short-able pullback is likely from the D target or very close to it. Was last week’s 3753 high close enough? I doubt it, and for that reason I will suggest waiting until it is actually touched, or approached within 1.50 points, before we start looking for an ‘rABC’ set-up to open a low-risk short position. Stay tuned to the chat room if you’re interested. ______ UPDATE (Jan 4, 7:30 p.m. EST): Apologies, since it is with 20-20 hindsight that I belatedly presented this sweet rABC set-up this morning in the chat room. A point I made at the time bears repeating, to wit: The more certain you are of a precise turn from ‘D’, the narrower the A-B interval you need to get the job done. Please note as well that the rABC pattern can be used predictively in the same ways we use conventional ABC patterns. In this case, the decisive breach of p=3716 on the way down affirmed that the downtrend was almost certain to reach D=3659.75. ______ UPDATE (Jan 7, 10:51 p.m.): The pattern shown leaves little room for doubt about where this relentless rally is headed. Opportunities to get aboard have been discoverable on the intraday charts, but so far there have been none signaled on the daily chart.
ESH21 – March E-Mini S&Ps (Last:3809.00)