
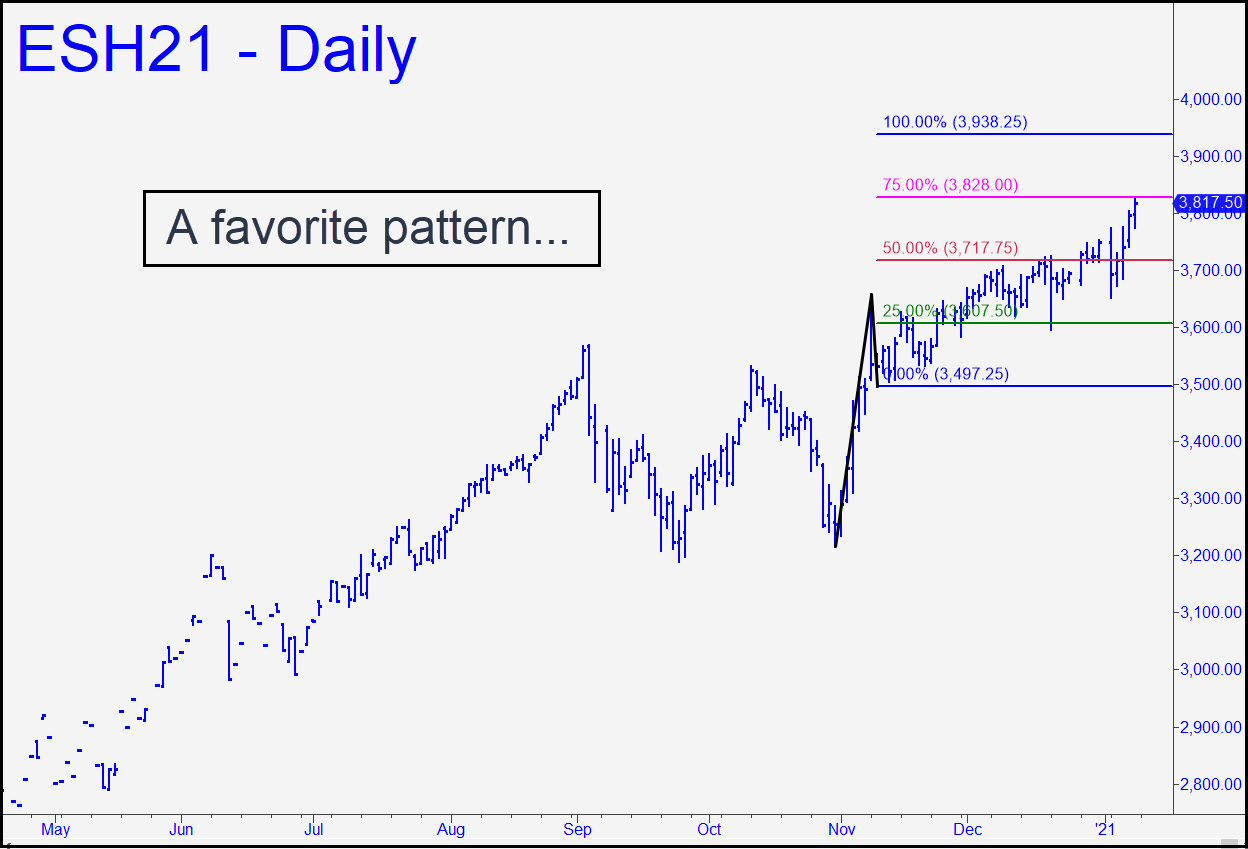
 The chart introduces a new target and a pattern that has worked beautifully since its inception in early November. On the way to the 3938.25 target, it delivered a textbook ‘mechanical’ buy at the green line just before Christmas and has the potential to do so again with a pullback to p=3717.75. Even if this doesn’t happen we’ll still have a target we can use for a precise and reliable handle on the trend. I do not intend for the target to supersede one at 3967.75 that comes from a much larger pattern that has been featured here for a while. But the provenance of the new one is so compelling that it warrants being our focus for the time being. The quick ABC followed asymmetrically by an elongated C-D segment yields some of the most reliable and useful targets I have observed, and that’s why I am so jazzed about this one. _______ UPDATE (Jan 14): Zzzzzzzzzzzzzz. The futures have spent the last five days lollygagging within inches of the target pattern’s secondary pivot at 3828.00. It’s neither illogical nor inconceivable for a bull market to fail at this benchmark, but it would take a plunge exceeding the 3596.00 ‘external’ low recorded on 12/21 to nail down such a bearish conclusion. ______ UPDATE (Jan 15, 11:50 a.m.): The hard stall at p2=3828, as well as my growing suspicion that the jig is up for the bull hoax begun on March 23, makes me less eager to buy p=3717.75 ‘mechanically’. Cancel the bid, although I’ll still sanction bottom-fishing there if you know how to use an rABC set-up to cut the $5500 entry risk down to a theoretical $300 or so per contract.
ESH21 – March E-Mini S&Ps (Last:3770.25)