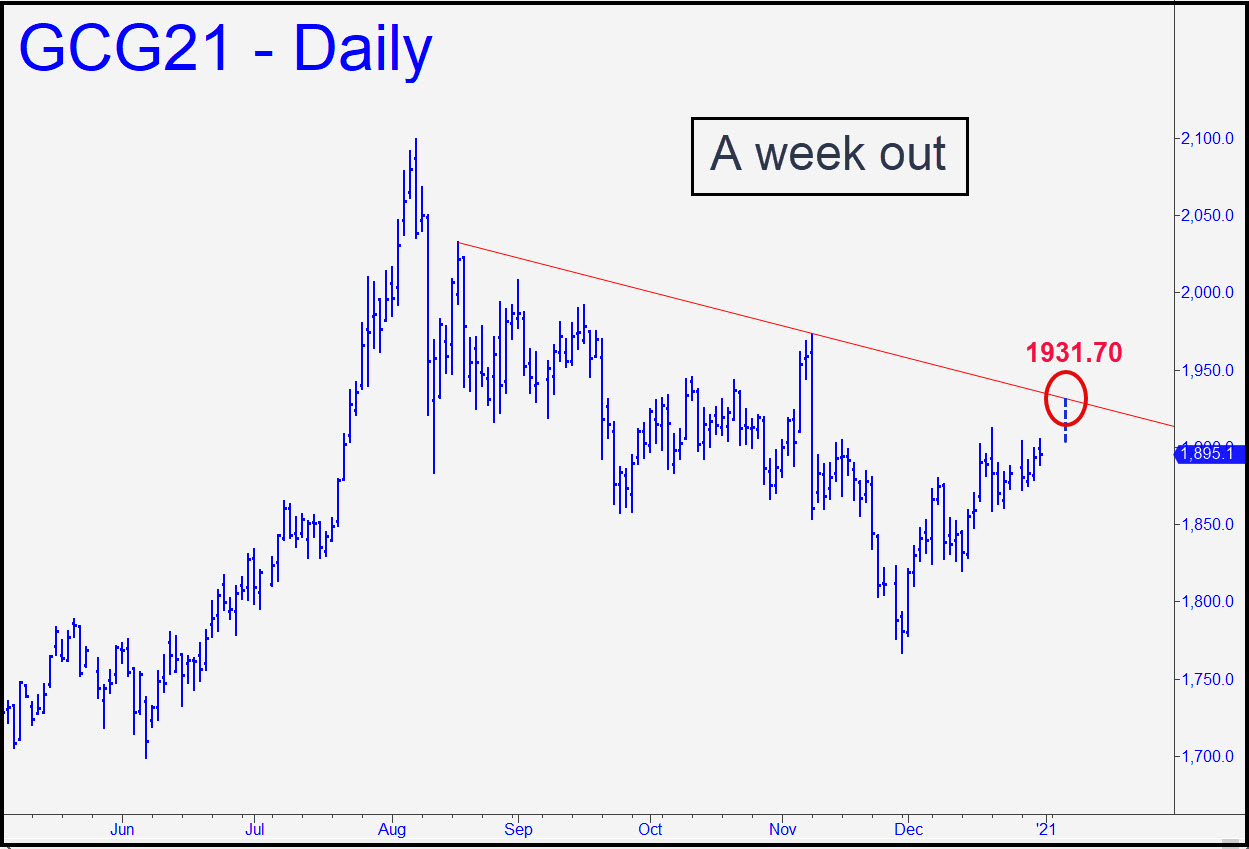
The somewhat persuasive trendline shown in the chart yields a 1931.70 rally target at week’s end that sits about 2% above current levels. I’d suggest using this number as a minimum upside objective, since the trendline looks more interesting than any Hidden Pivot patterns I can offer you at the moment. There is one projecting to 1949.80 (daily, A =1820.00 on 12/14), however, that appears serviceable as a minimum ‘extension’ target if 1931.80 should be easily pushed aside. Either of these number can be shorted with a stop-loss as tight as 0.80 points if you’ve made money on the way up. _______ UPDATE (Jan 4, 7:59 p.m.): Today’s so-far high has gotten within 0.60 of the 1949.80 target. Now, the 1967.10 midpoint Hidden Pivot shown in this chart promises to take the guesswork out of what’s coming next. You can make it your minimum upside objective for the very near term. _______ UPDATE (Jan 6, 8:02 p.m.): The intraday high of today’s bull-trap rally failed not only to reach our p=1967.10 benchmark, it also failed to clear the 1973.30 ‘external’ peak recorded on 11/9. I believe that gold sellers got the news wrong today and that the weakness was an opportunistic sucker punch. Even so, the technical warning signs are not to be ignored, so let’s stipulate that the futures must close for two consecutive days above p, or trade more than $15 above it intraday, to earn back our confidence.
GCG21 – February Gold (Last:1918.00)