
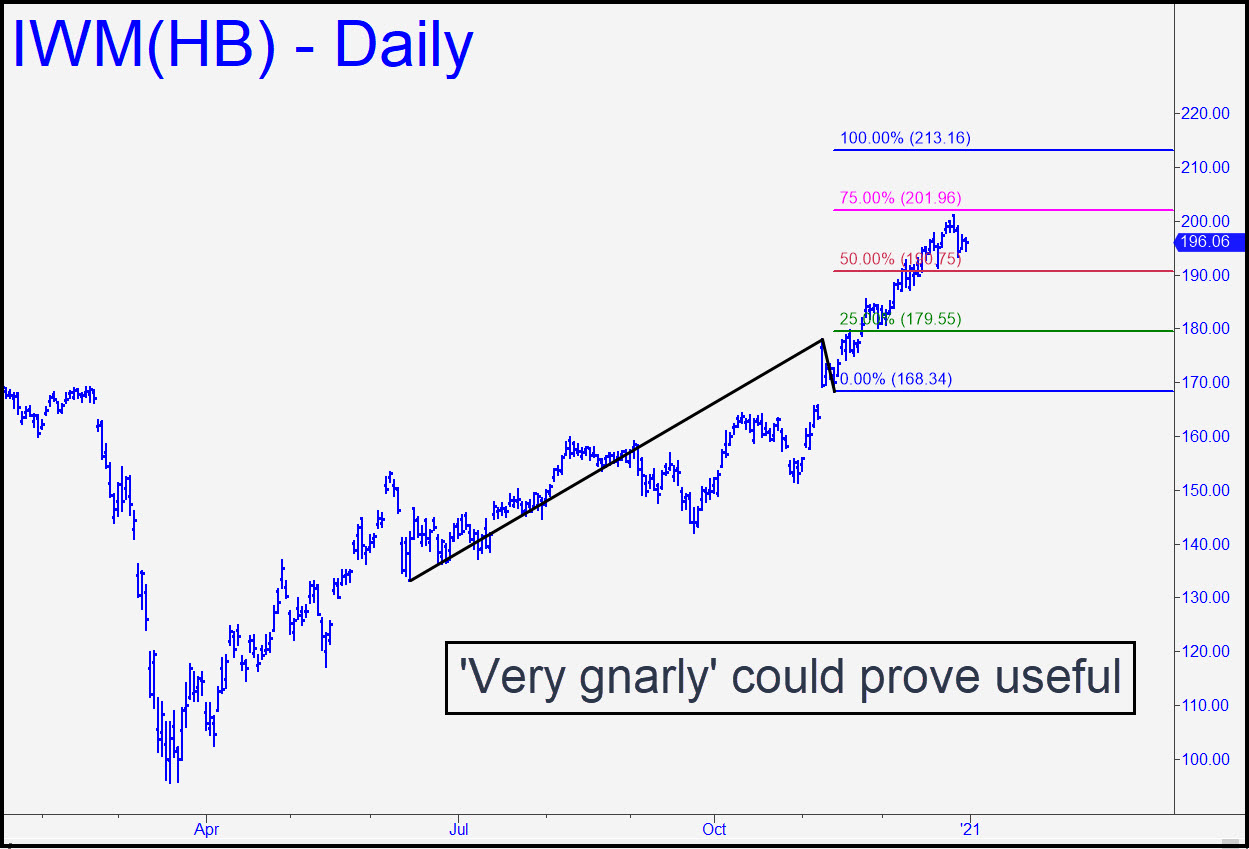
 I haven’t featured the Russell 2000 ETF on the home page because I did not want to queer a 199.25 target that had looked very promising. IWM has since exceeded it by nearly two points, an overshoot that is probably, although not quite necessarily, sufficient for us to infer that still higher prices lie ahead. Accordingly, I am presenting a new chart with a D target at 213.16 that can serve our purposes for now. A pullback to p=190.75 would trigger a ‘mechanical’ buy, stop 183.21, but I am not going to recommend the trade because it looks too risky. Instead, I’ll suggest getting long at x=179.55 if the opportunity arises. The pattern is a gnarly as they come, but those of you who have taken the Hidden Pivot Course will recognize it as capable of identifying a major top very accurately. The key to the pattern is the textbook legitimacy of the point ‘B’ high, which exceeded an ‘external’ peak recorded last February. For now, we hold some Feb 19 put butterfly spreads centered on the 150 and 160 strikes that will require no attention or adjustment, just a little luck. ______ UPDATE (Jan 4, 6:16 p.m. EST): On the first trading day of the new year, bears blew a seasonal opportunity to go on the attack for a rare change. Instead, they eked out a modest decline that hinted of more skirmishes as the week wears on. Freakish news could be their best hope, but we should be careful what we wish for. _______ UPDATE (Jan 7, 10:26 p.m.): As expected, IWM is closing fast on the 213.16 target. No ‘mechanical’ buying opportunities have arisen on the daily chart, although there was one near-miss. Go short at 213.20 using puts if you’ve made money on the way up.
IWM – Russell 2000 ETF (Last:208.17)