
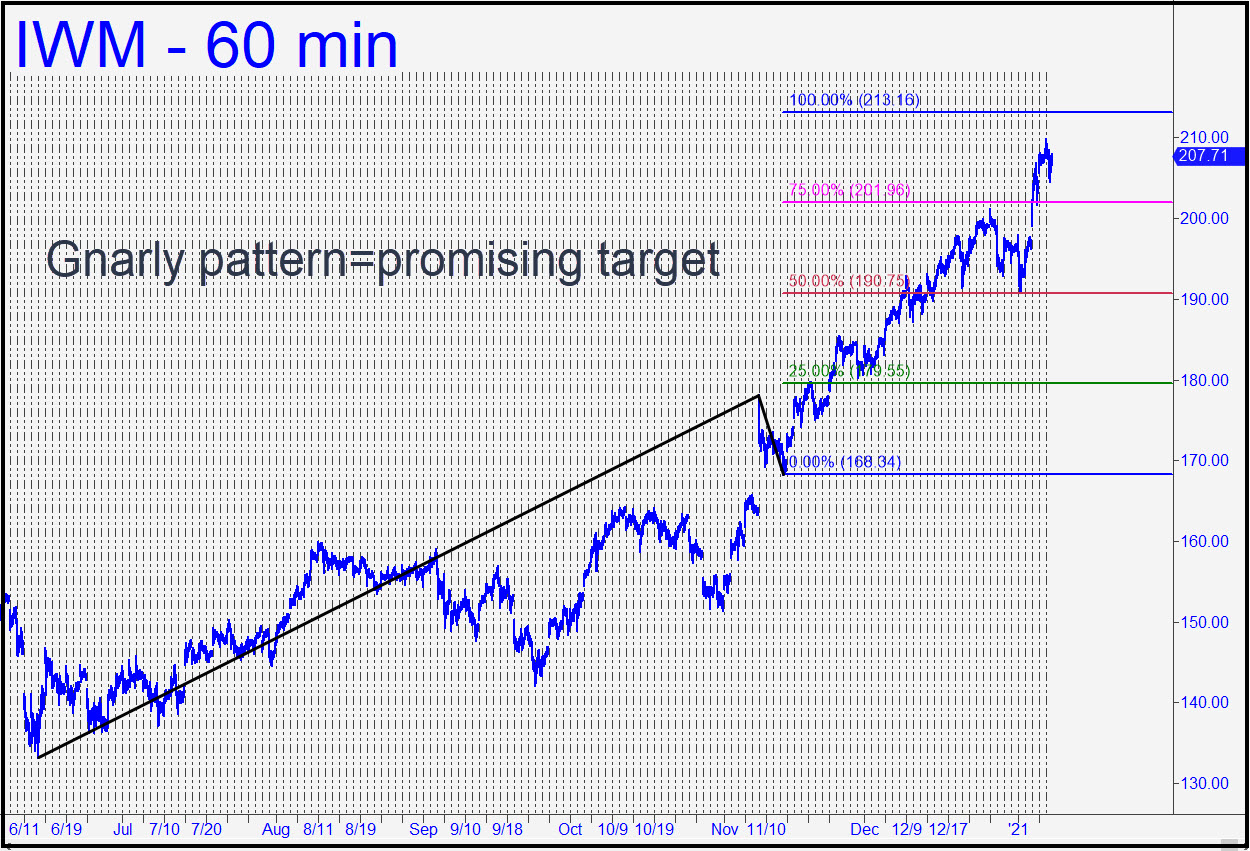
 The pattern shown is a ’10’ on the gnarly scale, but that won’t diminishes its odds of working for us. That means you can use the 213.16 target as a minimum upside projection for the near term. It should also suffice as place to try shorting with a tight stop-loss, a trade that I recommend using put options if you’ve made money on the way up. Be alert to a possible stall that may be short-able at exactly 211.36. That’s the ‘D’ target of a lesser pattern on the hourly chart that began with Dec 2’s 180.76 low. As always, if bulls punch through the higher target with ease, that would imply another leg up after a pullback. ______ UPDATE (Jan 12, 5:14 p.m.): Careful! IWM stalled three cents from the ‘alternative’ Hidden Pivot flagged above. The very shallow pullback since would seem to imply bulls are game for a possible finishing stroke to 213.16. If you shorted the high, stick with it for now and let me know in the chat room what position you hold. ______ UPDATE (Jan 14, 6:20 p.m.): Subscribers were advised to buy a few Feb 5 170 puts for around 0.22, in case next week’s inauguration does not come off as smoothly as expected. I’d say the chances of that are around 20%-25%, but our puts effectively give us much juicier odds. IWM traded as high as 215.00, today, implying the mindless herd is intent on stampeding at least a little higher. However, I’ve advised put buyers to put the trade out of mind, since we are just taking a shot. _______ UPDATE (Jan 20, 8:01 p.m.): See my 17:50 post in the trading room today for timely guidance.
IWM – Russell 2000 ETF (Last:213.94)